Why Educational AI Needs a Pedagogical Representation
Ask an AI to teach negative numbers, and it will happily generate an explanation, a worksheet, and even a diagram.
Yet something fundamental is missing.
The AI knows what to draw, but it doesn’t know why that diagram exists.
If you look closely at how these AI systems build educational experiences, you will notice a recurring pattern. The output is almost always:
- Text first
- Pedagogy second
- Structure last
We are treating AI tutors as sophisticated document generators.
But education is not document generation.
It is the structured sequencing of concepts, actions, feedback, and assessment.
What AI tutors are missing today is a representation layer for pedagogy. We need a way to represent the instructional decisions great teachers make, not just the words they say.
The Problem with Drawing Diagrams
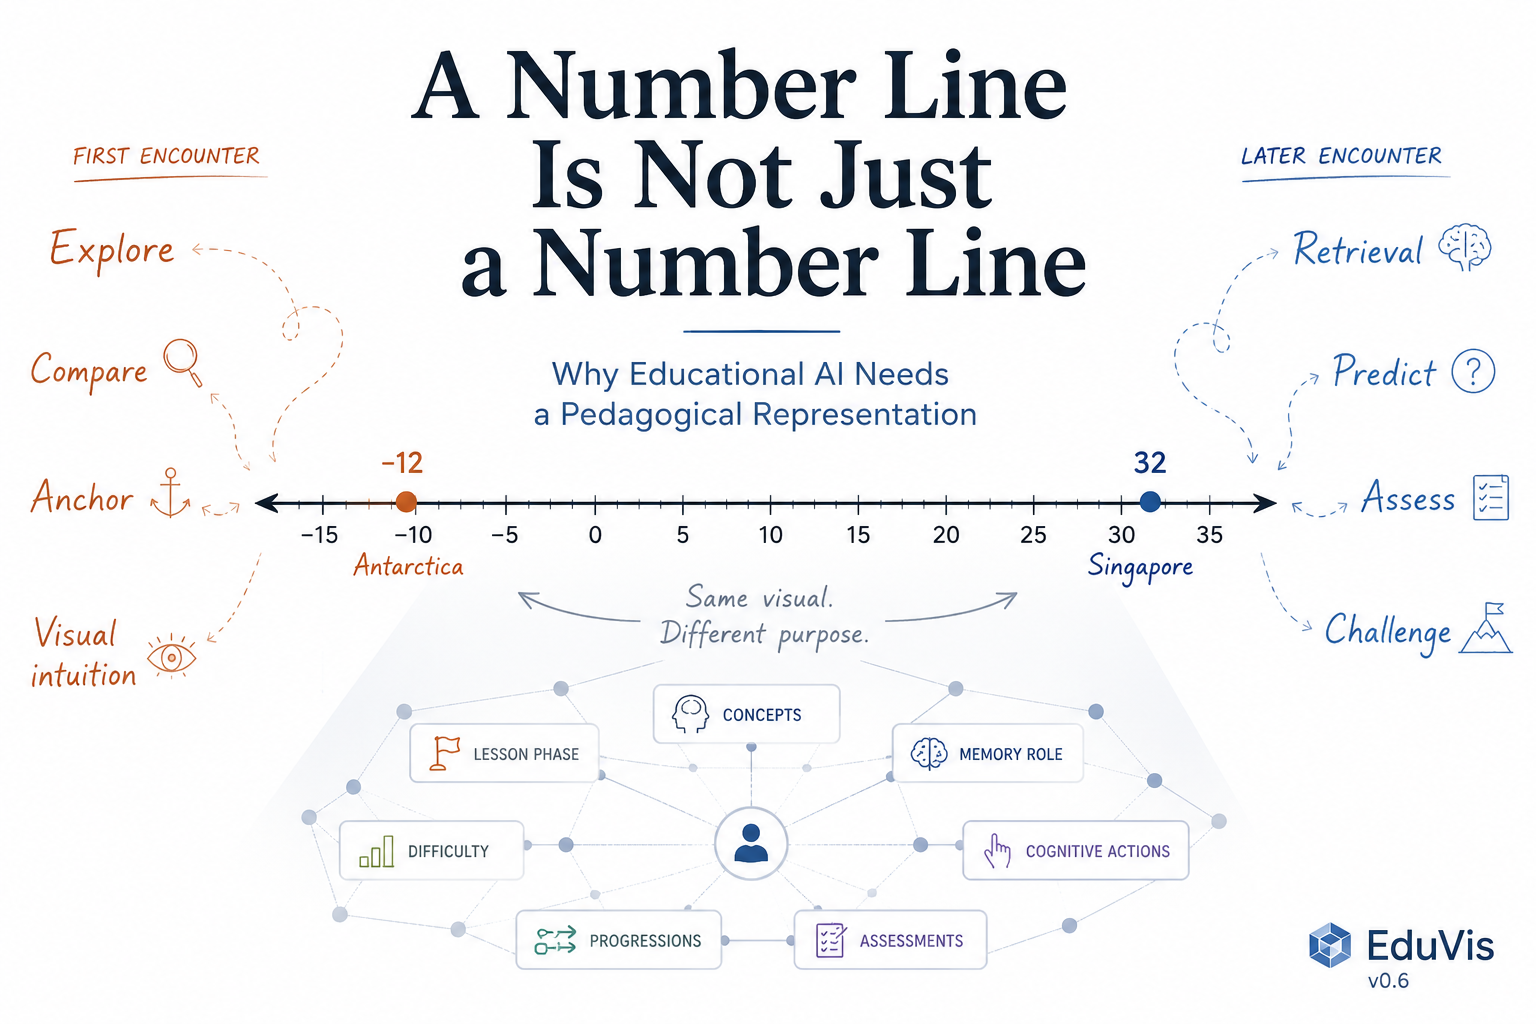
Consider a simple number line.
A number line used to introduce negative numbers for the very first time and a number line shown three weeks later in a quick recall exercise look almost identical. Physically, they both render as a horizontal line with tick marks.
But pedagogically, they are completely different objects.
Today’s diagramming tools and visual libraries cannot represent this difference. They treat them identically:
# What every visual library sees:
type: number_line
range: [-15, 35]
highlight: [-12, 32]When a human teacher draws a number line on a whiteboard, the visual is merely the endpoint of a complex web of pedagogical decisions. The teacher is thinking:
- Where does this sit in the lesson progression? (Are we exploring a pattern, explaining a rule, or testing retention?)
- What is the cognitive load? (Should we highlight labels to guide them, or hide labels to force active recall?)
- What is the student expected to do? (Notice a difference, predict a missing value, or apply a procedural step?)
When a visual library exports a diagram to an SVG, all of that pedagogical intent is flattened and destroyed. The system knows what pixels to draw, but it has no idea why it is drawing them.
The Missing Layer
What we need is a machine-readable instructional representation that separates meaning from rendering.
Think about what Markdown did for documents, or what Mermaid did for diagrams. Markdown separates content from presentation. Mermaid separates graph structure from rendering. Educational AI needs a similar separation between pedagogy and delivery.
We need a way to describe learning experiences where pedagogy comes first, structure second, and rendering last.
| Target Domain | Abstraction / Tool |
|---|---|
| Documents | Markdown |
| Diagrams | Mermaid |
| User interfaces | HTML |
| Educational experiences | EduVis |
Instead of telling the AI to “draw a number line with Singapore at 32 and Antarctica at -12,” we define the underlying pedagogical intent:
# What an instructional representation represents:
id: explore_temperature_comparison
type: number_line
placement:
  lesson_phase: explore          # Where we are in the pedagogical journey
  memory_role: anchor            # The role this visual plays in long-term memory
  difficulty: starter            # Designed to build initial confidence
actions:
  conceptual:
    - compare: [-12, 32]         # The explicit cognitive action expected
range: [-15, 35]
highlight:
  - value: -12
    label: "Antarctica"
  - value: 32
label: "Singapore"Because the representation captures the meaning, the system understands that Singapore and Antarctica are anchor points meant for comparison.
If the student is exploring the concept for the first time, the player renders the full labels to support visual intuition. If the student encounters the exact same element weeks later during a spaced retrieval exercise, the player can automatically hide the “-12” label, swap the action from compare to predict, and present it as an active recall card.
The exact same representation could be rendered as:
- An SVG diagram embedded in a web lesson
- A slide projected in a classroom
- An interactive drag-and-drop web activity
- A spoken explanation by a voice tutor
without changing the underlying pedagogical intent. The representation remains the same; the rendering adapts.
Why I Started Building EduVis
Over the past few months, I have been exploring this exact problem, which led to the creation of EduVis , an open-source pedagogical representation framework.
EduVis is an open, curriculum-aware framework for representing learning experiences. It is not an SVG schema. It is a way to model curriculum graphs, learning progressions, pedagogical intent, student actions, assessment evidence, and visual representations as orthogonal layers.
With v0.6, EduVis has evolved beyond a collection of pedagogical visual elements into a framework for representing learning experiences. It now models concepts, relationships, learning progressions, assessments, and visual representations as separate but connected layers, making it possible for AI systems to reason about teaching rather than simply generating educational graphics.
While building EduVis, I realized something unexpected: many of the instructional patterns that exist only in experienced teachers’ heads can be made explicit, machine-readable, and reproducible.
Without a representation layer like EduVis, an AI lesson generator asks:
“Draw three diagrams about negative numbers.”
With it, it asks:
“I need one
anchorelement in theexplorephase, aconceptual_modelbefore theprocedurein theexplainphase, oneguided_practiceworked example, threestarterpractice problems to build confidence, fiveroutineproblems, onechallenge, and tworetrievalitems.”
The generator is no longer assembling graphics. It is assembling a learning experience—one that follows the same structure that makes human tutors effective. No skipped steps, visual intuition before abstraction, confidence-building before challenge, and retrieval to lock it in long-term.
The Core Idea: Separate Orthogonal Layers
One of the design principles behind EduVis is that educational content should be decomposed into independent layers.
A traditional lesson often mixes everything together:
- Curriculum concepts: The specific academic skills being targeted.
- Visual presentation: The design, dimensions, and styling of elements on screen.
- Assessment questions: How understanding is verified.
- Learning progression: The order in which components are revealed.
- Teaching strategy: How scaffolding, hints, or remediation are delivered.
This tight coupling makes adaptation extremely difficult. If you want to change how a lesson is rendered (e.g., from an SVG on a webpage to a voice script on a smart speaker), you have to rewrite the entire lesson.
EduVis instead models these concerns as independent layers:
- Concepts: The curriculum knowledge graph and prerequisites.
- Relationships: How components connect (such as how a specific hint blocks or remediates a practice question).
- Progressions: The pedagogical flow pattern (like the
confidence_laddersequence). - Assessments: Interactive validation targets and marking rubrics.
- Visual Elements: Domain-specific pedagogical primitives (like number lines or fraction models) rather than generic graphic primitives (like rectangles or lines).
Because these layers are orthogonal, a renderer can decide how something looks, an AI tutor can decide how it is delivered, and a curriculum engine can decide when it should be taught—all while the underlying representation remains unchanged.
Current Status & Tooling
EduVis is available today as an open-source Python package. The project currently includes:
- Pedagogy-first representations for structuring curriculum concepts, lesson progressions, and interactive assessments.
- A reference SVG renderer that translates math-specific element specs directly into high-fidelity visuals.
- An interactive live editor and playground running the entire Python framework in the browser using WebAssembly.
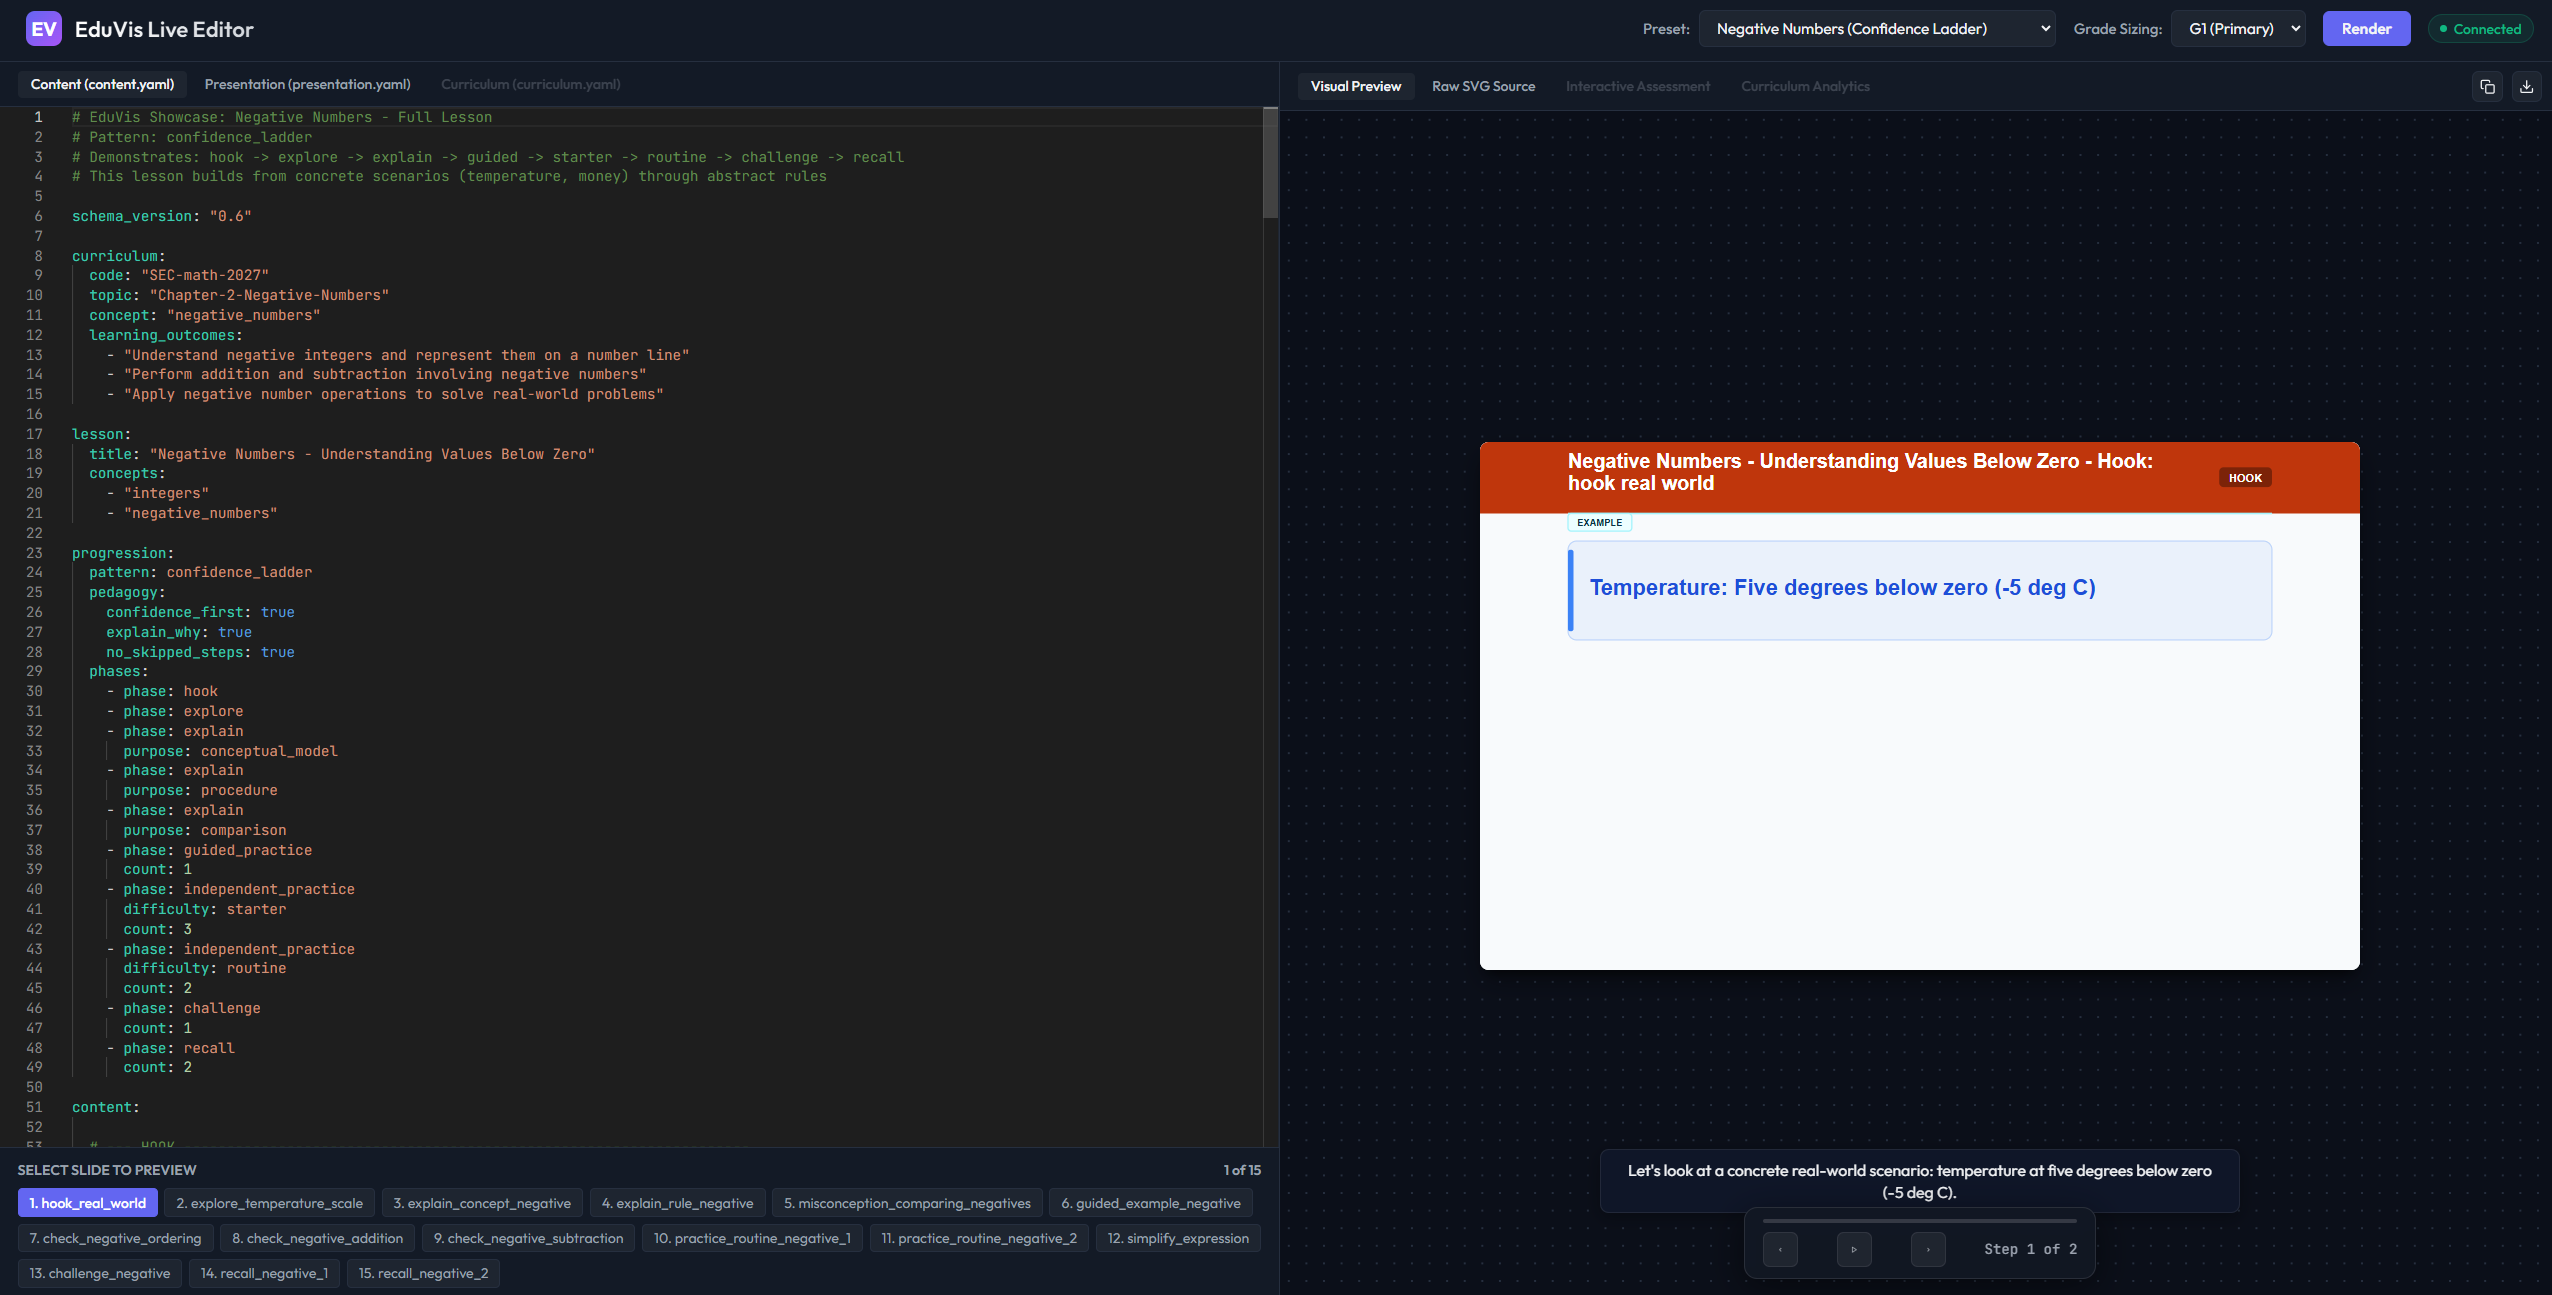
The live editor lets you experiment with EduVis schemas in the browser and immediately see how pedagogical representations are rendered into instructional visuals.
- Explore the code on GitHub
- Check out the package on PyPI
- Try the Live Schema Editor and Interactive Showcase
The Road Ahead
For AI engineers, agent developers, and knowledge representation enthusiasts building the future of educational AI, the most interesting challenge right now isn’t generating better text or prettier SVGs. It is defining the data structures that map human cognition and pedagogy.
Concepts, relationships, progressions, assessments, pedagogical intent, misconception handling—these ideas need to exist as first-class citizens in our codebases, not just as implicit instructions hidden inside ChatGPT prompts.
When we separate presentation (how to deliver), curriculum (what to learn), and pedagogical progression (how learning is structured) into orthogonal layers, we unlock the ability for learning paths to adapt dynamically.
The future of AI tutoring will not be defined solely by larger models or better prompts. It will be defined by how well we can represent pedagogy itself.
If we want AI to teach like great educators, we first need a way to describe what great educators do.
Before AI can teach well, it must first understand what teaching is.
That is the problem EduVis is trying to solve.