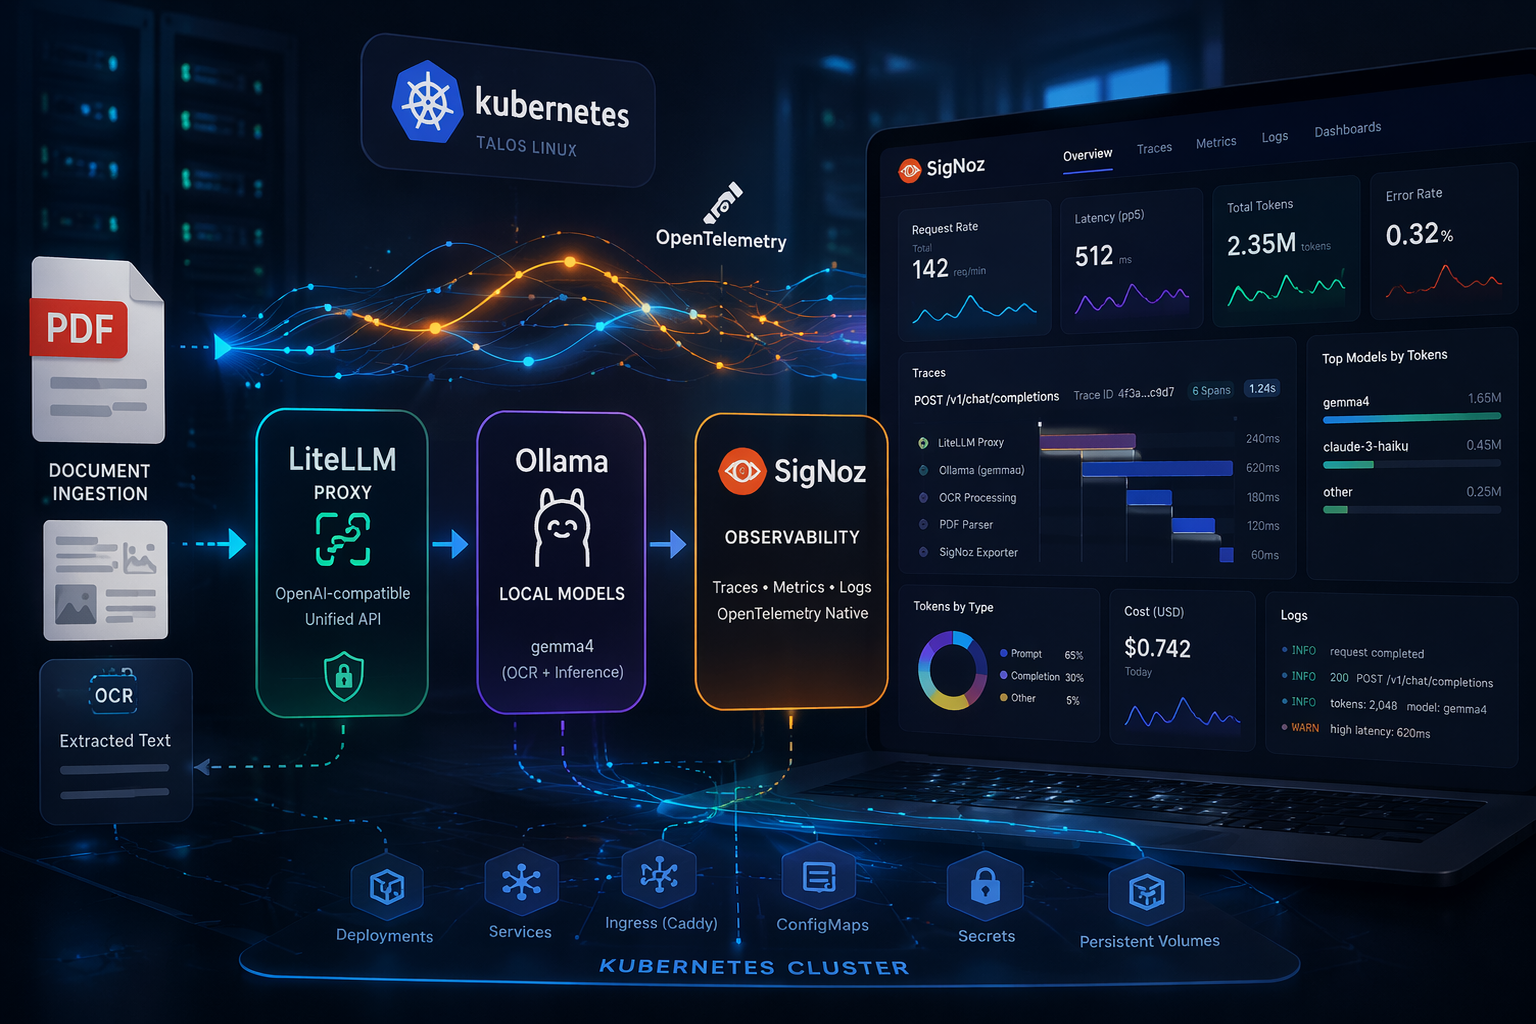
In my previous homelab post I demostrated on how datadog is setup for observability for my VoiceDoc Agent project. Here I wanted to deploy SigNoz , as an open source alternative to Datadog for traces, metrics, and logs in a unified, OpenTelemetry-native platform.
Motivation
Previously, I used Kiali for observability, as documented in my Microservices with Talos post . While Kiali is excellent for service mesh visibility, it is also quite Kubernetes and Istio centric, and often needs to be paired with additional tools to provide a more complete observability experience.
For smaller AI-centric workloads, I wanted something simpler and more self-contained.
Self-hosting SigNoz turned out to be a much cleaner fit for lightweight projects like PDF Fusion , especially since I wanted a single place to inspect traces, metrics, and request flow across the stack.
Setup
PDFusion Setup
Clone the project:
git clone https://github.com/seehiong/pdfusion.git
cd pdfusionFor backend setup:
python -m venv venv
.\venv\Scripts\activate
pip install -r server/requirements.txt

cp .env.example .env
ollama run gemma4For frontend setup:
npm install
npm audit fixTo run both:
npm run server
npm run devFor the initial standalone local setup, this is my .env:
VITE_API_BASE_URL=http://localhost:8000
DATABASE_URL=postgresql://postgres:postgres@localhost:5432/pdfusion
VISION_MODEL_ID=ollama/gemma4
LITELLM_API_BASE=http://localhost:11434
LITELLM_API_KEY=sk-local-proxy
UPLOAD_DIR=uploads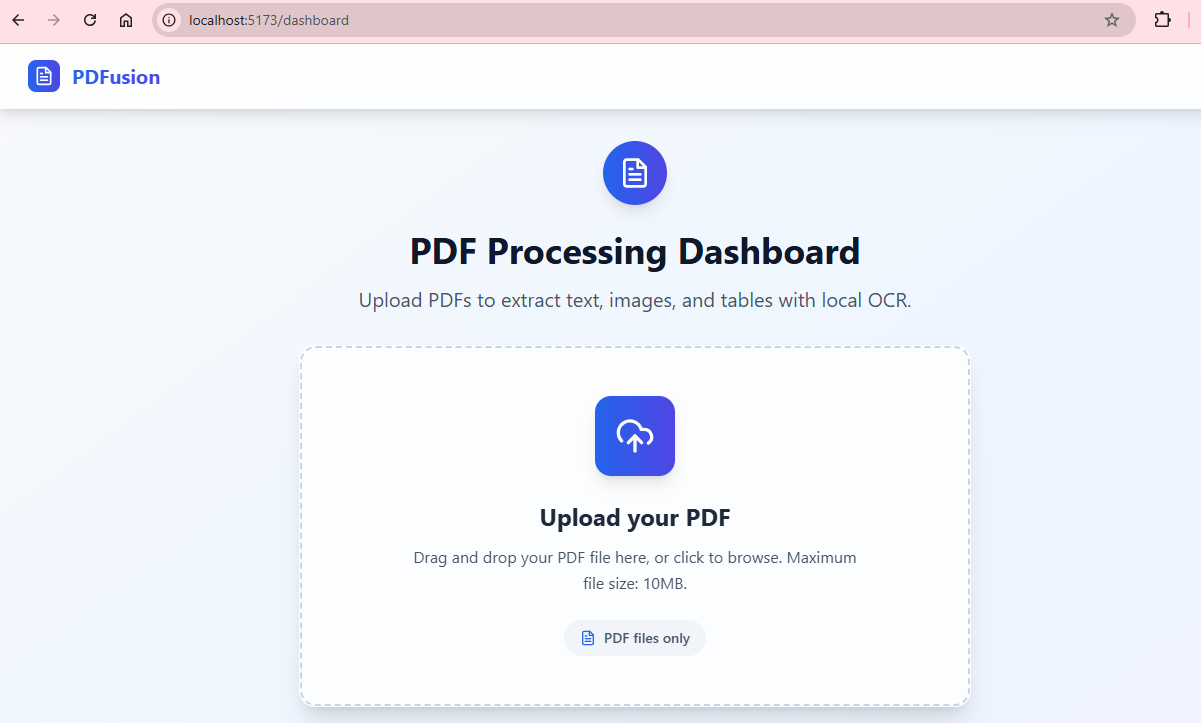
OUTPUT_DIR=outputsThe application will be accessible at http://localhost:5173.
Signoz Setup
For the SigNoz deployment, I used the official Helm chart from charts.signoz.io, with the full setup managed through a values.yaml file.
One of the most important decisions was the storage layout. In a homelab, it can be tempting to back persistent volumes with NFS, but that is usually a poor fit for ClickHouse, which powers SigNoz’s metrics, traces, and logs. The combination of latency, filesystem semantics, and write-heavy database workloads can easily lead to instability or degraded performance.
To avoid that, I used the local-path storage class for the stateful components:
ClickHouse: 20Gi for traces, metrics, and logs ZooKeeper: 2Gi for coordination SigNoz frontend metadata: 1Gi
I also disabled the built-in ingress in the Helm chart (frontend.ingress.enabled: false) since I am already using Caddy as the cluster-wide reverse proxy and TLS entry point.
Show full values.yaml
# ---------------------------------------------------------------------------
# Global storage class — use local-path to avoid NFS file locking issues
# ---------------------------------------------------------------------------
global:
  storageClass: "local-path"
  clusterName: "homelab"

# ---------------------------------------------------------------------------
# SigNoz frontend + query service
# ---------------------------------------------------------------------------
signoz:
  persistence:
    enabled: true
    storageClass: "local-path"
    size: 1Gi

# ---------------------------------------------------------------------------
# ClickHouse — main data store for traces, metrics, logs
# ---------------------------------------------------------------------------
clickhouse:
  persistence:
    enabled: true
    storageClass: "local-path"
    size: 20Gi
  zookeeper:
    persistence:
      enabled: true
      storageClass: "local-path"
      size: 2Gi

# ---------------------------------------------------------------------------
# Ingress — disabled, Caddy handles TLS at signoz.local
# ---------------------------------------------------------------------------
frontend:
  ingress:
enabled: falseCaddy Setup
Caddy acts as the entry point for both the human-facing dashboard and the machine-facing OTLP ingestion endpoints. In this setup, it handles TLS termination and reverse proxying for both the SigNoz UI and the OpenTelemetry collectors.
1. Dashboard Access
The frontend is exposed at https://signoz.local with TLS certificates mounted from Kubernetes secrets.
2. Exposing OTLP Collectors
To allow external applications and services to send telemetry into SigNoz, the OpenTelemetry (OTLP) ports also need to be exposed.
Caddy handles both transport types:
- gRPC (Port 4317): requires h2c (HTTP/2 Cleartext), since the internal collector service is not serving TLS directly
- HTTP (Port 4318): a standard reverse proxy path for OTLP over HTTP
When proxying gRPC through Caddy, do not forget the transport http { versions h2c } block. Without it, Caddy will attempt to speak HTTP/1.1 or regular HTTP/2 to the upstream, which will break raw gRPC traffic.
For LiteLLM, I also had to explicitly forward the correct proxy headers to fix a UI redirect issue (HTTP/1.1 307 Temporary Redirect) caused by the backend generating redirects based on the wrong upstream host.
Show full Caddy Kubernetes manifest (all-in-one.yaml)
apiVersion: v1
kind: Namespace
metadata:
  name: caddy
---
apiVersion: v1
kind: ConfigMap
metadata:
  name: caddy-config
  namespace: caddy
data:
  Caddyfile: |
    # Dashboard and Metrics
    signoz.local {
      tls /certs/signoz/tls.crt /certs/signoz/tls.key
      reverse_proxy signoz-frontend.signoz.svc.cluster.local:3301
    }

    litellm.local {
      tls /certs/litellm/tls.crt /certs/litellm/tls.key
      reverse_proxy litellm.litellm.svc.cluster.local:4000 {
        header_up Host {host}
        header_up X-Forwarded-Host {host}
        header_up X-Forwarded-Proto https
        header_up X-Forwarded-Port 443
      }
    }

    # OTLP Aggregation (gRPC)
    :4317 {
      tls /certs/signoz/tls.crt /certs/signoz/tls.key
      reverse_proxy signoz-otel-collector.signoz.svc.cluster.local:4317 {
        transport http {
          versions h2c
        }
      }
    }

    # OTLP Aggregation (HTTP)
    :4318 {
      tls /certs/signoz/tls.crt /certs/signoz/tls.key
      reverse_proxy signoz-otel-collector.signoz.svc.cluster.local:4318
}PostgreSQL Setup
LiteLLM requires a database to manage its state, API keys, and UI configuration. I deployed PostgreSQL using the official Bitnami Helm chart for this purpose.
# Add the Bitnami repository
helm repo add bitnami https://charts.bitnami.com/bitnami
helm repo update bitnami

# Install PostgreSQL
helm install postgres bitnami/postgresql \
  --namespace postgres \
  --create-namespace \
  --set auth.postgresPassword=postgres \
--set primary.service.type=LoadBalancerOllama Setup
To host local AI models such as gemma4 for OCR tasks in PDFusion, I deployed Ollama as part of the stack.
Because larger models can be memory-intensive, LiteLLM is configured to proxy model requests to a higher-performance external node (my host PC) when needed. This keeps the Kubernetes control plane and lighter worker nodes from being overloaded while still preserving a single API endpoint for inference.
LiteLLM Setup
To provide a unified LLM gateway for the homelab and support local OCR tasks in PDFusion, I deployed LiteLLM as an OpenAI-compatible proxy.
It sits between the application and the model providers, providing:
- a consistent OpenAI-style API
- model routing across local and hosted providers
- built-in OpenTelemetry instrumentation for traces and metrics
I am using the image ghcr.io/berriai/litellm:v1.82.3-stable.patch.2 and have integrated it with the cluster’s PostgreSQL instance and the SigNoz OpenTelemetry collector.
Security note (March 2026): LiteLLM versions 1.82.7 and 1.82.8 published on PyPI were part of a reported supply-chain compromise and were later quarantined.
My deployment here uses the pinned container image ghcr.io/berriai/litellm:v1.82.3-stable.patch.2, which is not one of the affected PyPI package versions. Still, if you install LiteLLM via pip or use it in local Python tooling, it is worth reviewing the official
incident write-up
and avoiding unpinned installs.
Show full LiteLLM Kubernetes Manifest (litellm.yaml)
apiVersion: v1
kind: Namespace
metadata:
  name: litellm
---
apiVersion: v1
kind: Secret
metadata:
  name: litellm-secrets
  namespace: litellm
type: Opaque
stringData:
  LITELLM_MASTER_KEY: sk-homelab-proxy-2026
  POSTGRES_PASSWORD: postgres
  ANTHROPIC_API_KEY: sk-bring-your-api-key

---
apiVersion: v1
kind: ConfigMap
metadata:
  name: litellm-config
  namespace: litellm
data:
  config.yaml: |
    model_list:
      - model_name: gemma4
        litellm_params:
          model: ollama/gemma4
          api_base: http://192.168.68.118:11434
          stream: true
      - model_name: claude-3-haiku
        litellm_params:
          model: anthropic/claude-3-haiku-20240307

    litellm_settings:
      set_verbose: True
      drop_params: False
      success_callback: ["otel"]
      failure_callback: ["otel"]
      turn_off_message_logging: False
      telemetry: True
      redact_user_api_key_info: True
      forward_traceparent_to_llm_provider: True
      ui: True

    callback_settings:
      otel:
        message_logging: True

    general_settings:
      master_key: sk-homelab-proxy-2026
      store_prompts_in_spend_logs: True
      store_model_in_db: True
---
apiVersion: apps/v1
kind: Deployment
metadata:
  name: litellm
  namespace: litellm
spec:
  replicas: 1
  selector:
    matchLabels:
      app: litellm
  template:
    metadata:
      labels:
        app: litellm
    spec:
      containers:
      - name: litellm
        image: ghcr.io/berriai/litellm:v1.82.3-stable.patch.2
        args:
        - --config
        - /app/config.yaml
        imagePullPolicy: IfNotPresent
        ports:
        - containerPort: 4000
        env:
        - name: LITELLM_MASTER_KEY
          valueFrom:
            secretKeyRef:
              name: litellm-secrets
              key: LITELLM_MASTER_KEY
        - name: POSTGRES_PASSWORD
          valueFrom:
            secretKeyRef:
              name: litellm-secrets
              key: POSTGRES_PASSWORD
        - name: ANTHROPIC_API_KEY
          valueFrom:
            secretKeyRef:
              name: litellm-secrets
              key: ANTHROPIC_API_KEY

        - name: DATABASE_URL
          value: postgresql://postgres:$(POSTGRES_PASSWORD)@postgres-postgresql.postgres.svc.cluster.local:5432/litellm
        - name: OTEL_EXPORTER
          value: "grpc"
        - name: OTEL_EXPORTER_OTLP_ENDPOINT
          value: "http://signoz-otel-collector.signoz.svc.cluster.local:4317"
        - name: OTEL_RESOURCE_ATTRIBUTES
          value: "service.name=litellm-proxy"
        - name: OTEL_TRACES_EXPORTER
          value: "otlp"
        - name: OTEL_METRICS_EXPORTER
          value: "otlp"
        - name: OTEL_LOGS_EXPORTER
          value: "otlp"
        - name: OTEL_DEBUG
          value: "True"
        - name: OTEL_SERVICE_NAME
          value: "litellm-proxy"
        - name: OTEL_TRACER_NAME
          value: "litellm-proxy"
        - name: LITELLM_LOG
          value: "INFO"
        - name: STORE_MODEL_IN_DB
          value: "True"
        - name: STORE_PROMPTS_IN_SPEND_LOGS
          value: "True"

        volumeMounts:
        - name: config-volume
          mountPath: /app/config.yaml
          subPath: config.yaml
      volumes:
      - name: config-volume
        configMap:
          name: litellm-config
---
apiVersion: v1
kind: Service
metadata:
  name: litellm
  namespace: litellm
spec:
  selector:
    app: litellm
  ports:
  - protocol: TCP
    port: 4000
    targetPort: 4000
type: ClusterIPIn Action (Verification)
For the earlier local setup, PDFusion was configured to talk directly to the standalone Ollama endpoint.
For the full end-to-end verification in this section, I updated the application to route model traffic through the LiteLLM proxy instead, so that requests would be fully observable in SigNoz.
Update your .env to:
VISION_MODEL_ID=ollama/gemma4
LITELLM_API_BASE=https://litellm.local
LITELLM_API_KEY=sk-homelab-proxy-2026This effectively chains the stack together as:
PDFusion → LiteLLM → Ollama → SigNoz
With the observability and LLM proxy stack running, let’s verify that each component is working end to end.
1. Verifying Ollama
If your models are properly cached and responding, querying the Ollama API on your host machine should return JSON metadata for gemma4.
Run this from your machine:
curl http://192.168.68.118:11434/api/tags

# Expected Output
# {"models":[{"name":"gemma4:latest","model":"gemma4:latest","modified_at":"2026-04-03T11:28:27.2295714+08:00","size":9608350718,
# "digest":"c6eb396dbd5992bbe3f5cdb947e8bbc0ee413d7c17e2beaae69f5d569cf982eb","details":{"parent_model":"","format":"gguf",
# "family":"gemma4","families":["gemma4"],"parameter_size":"8.0B","quantization_level":"Q4_K_M"}},...2. Verifying LiteLLM Proxy
With Ollama running on the host machine, you can test the full inference path through your cluster’s reverse proxy.
curl -k -X POST https://litellm.local/chat/completions ^
  -H "Content-Type: application/json" ^
  -H "Authorization: Bearer sk-homelab-proxy-2026" ^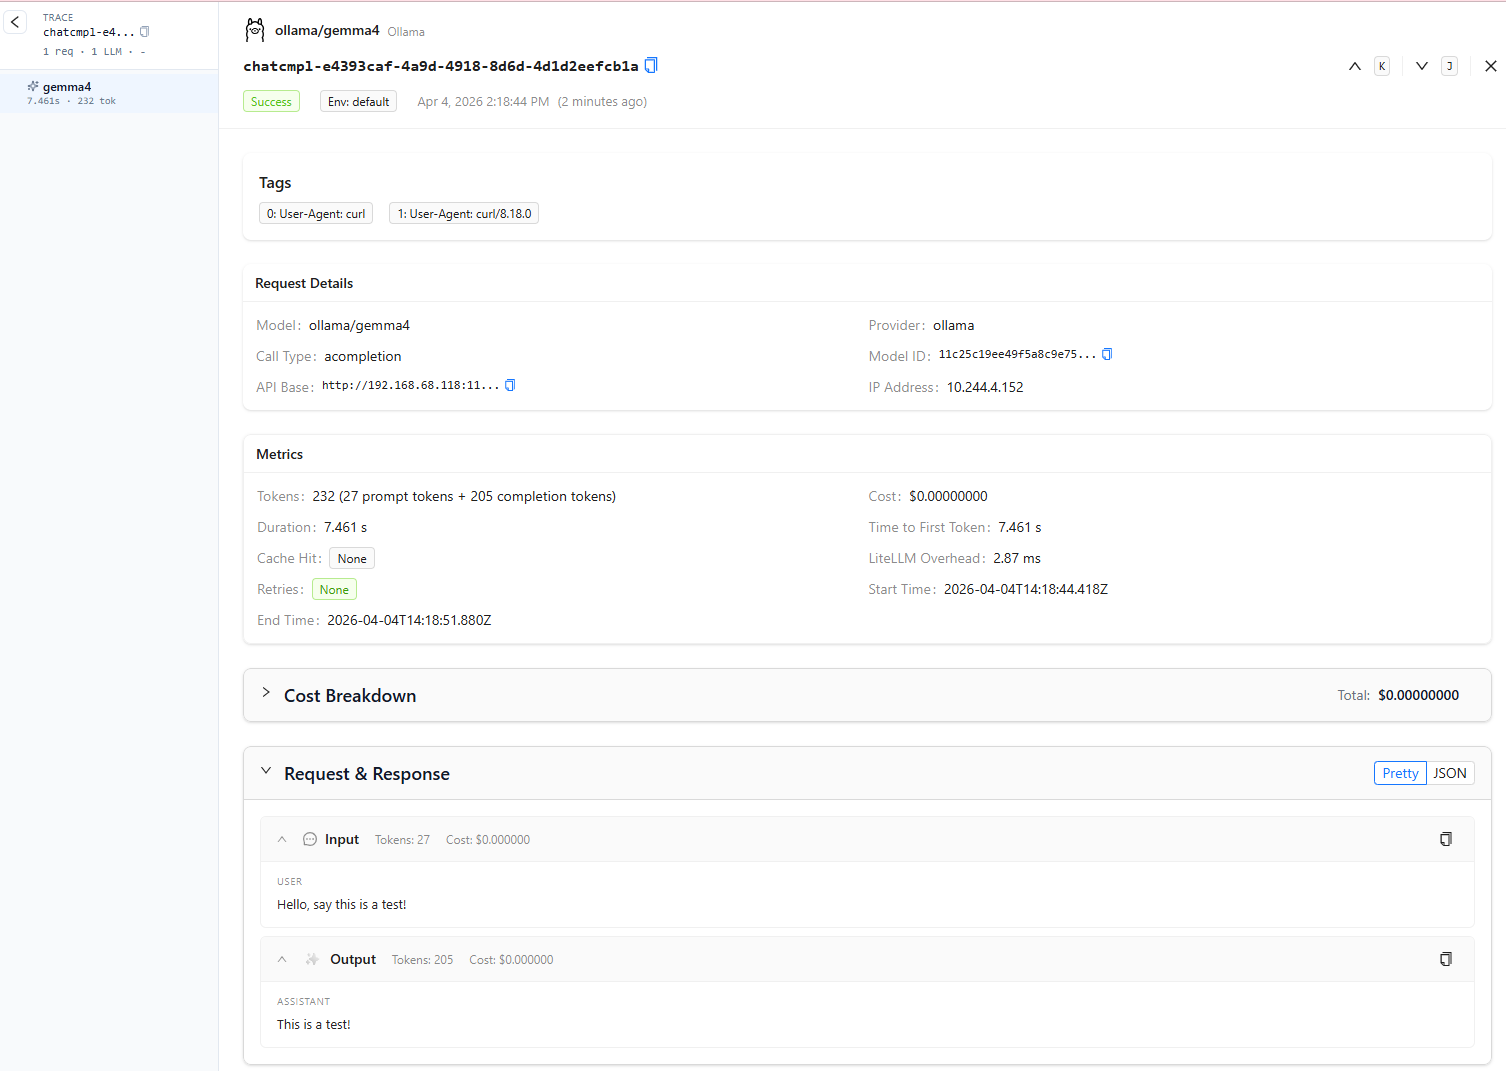
-d "{\"model\": \"gemma4\", \"messages\": [{\"role\": \"user\", \"content\": \"Hello, say this is a test!\"}]}"If everything is wired correctly, you should receive an OpenAI-compatible JSON response generated by gemma4.

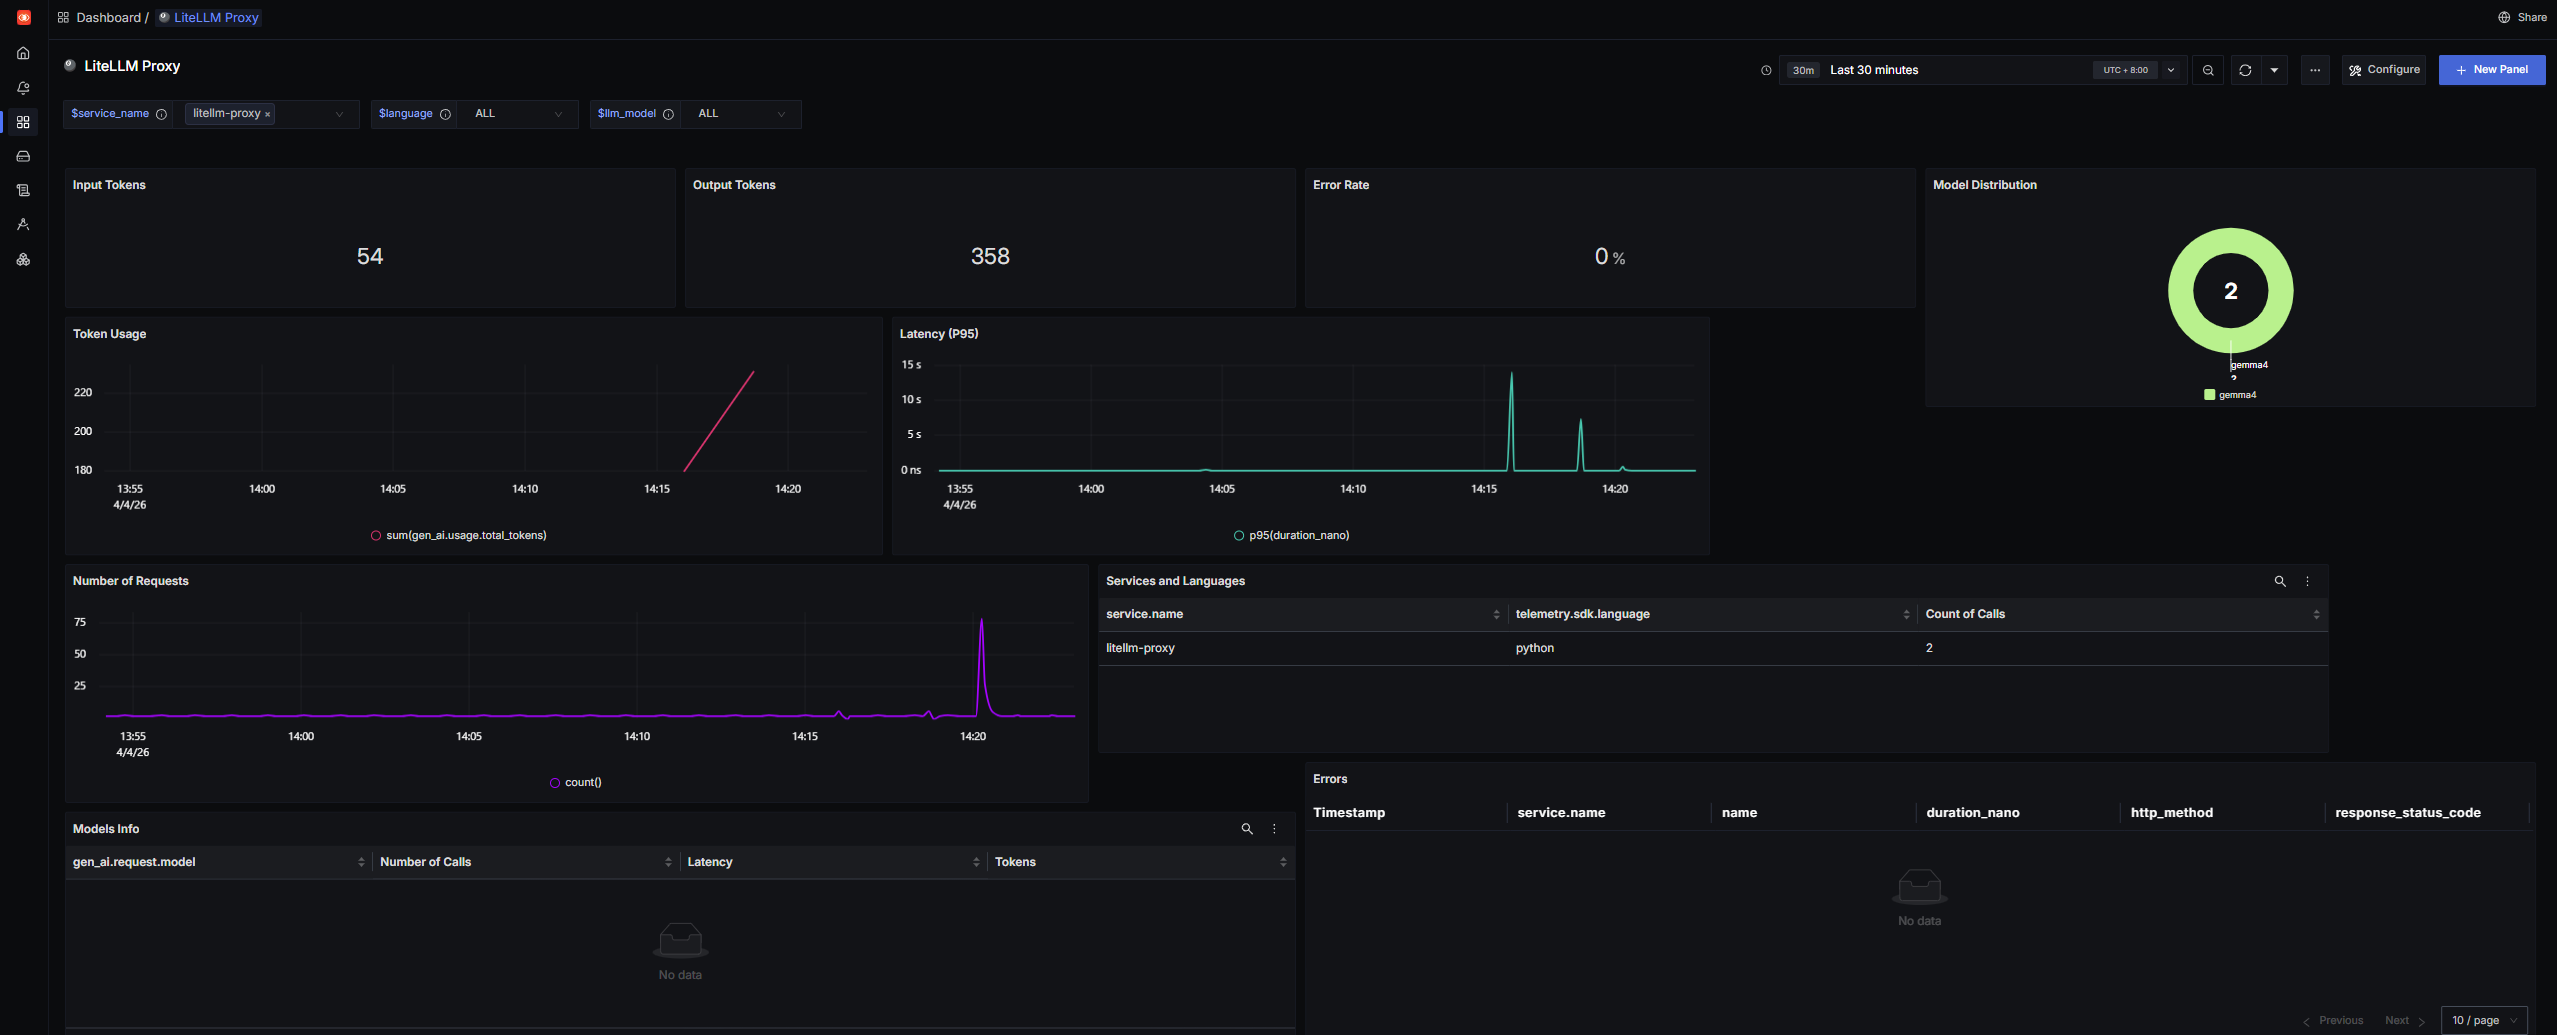
3. Visualizing Metrics in SigNoz
With the OpenTelemetry backend enabled (OTEL_METRICS_EXPORTER: "otlp"), LiteLLM is not just serving requests — it is also exporting operational telemetry into SigNoz.
Metrics such as:
- token usage
- request volume
- latency
- cost (where applicable)
are surfaced separately from traces. That means they will not automatically appear in the generic Trace Explorer view.
To visualize those metrics more effectively, import the official LiteLLM SDK Dashboard JSON .
The official LiteLLM dashboard template required a few manual query fixes before the panels populated correctly in my setup.
This appears to be due to differences between the published dashboard queries and the telemetry field names emitted by my current LiteLLM/OpenTelemetry stack.
I updated the following expressions manually:
-
Replace:
"expression": "sum(gen_ai.usage.prompt_tokens) ) ) )"with:
"expression": "sum(gen_ai.usage.input_tokens) ) )" -
Replace:
"expression": "sum(gen_ai.usage.completion_tokens) ) ) )"with:
"expression": "sum(gen_ai.usage.output_tokens) ) )" -
Replace:
"expression": "sum(llm.usage.total_tokens) ) ) )"with:
"expression": "sum(gen_ai.usage.total_tokens) ) ) ) )" -
Replace:
"expression": "count() as 'Number of Calls' avg(duration_nano) as 'Latency' sum(llm.usage.total_tokens) as 'Tokens'"with:
"expression": "count() as 'Number of Calls' avg(duration_nano) as 'Latency' sum(gen_ai.usage.total_tokens) as 'Tokens'"
If your imported dashboard shows empty charts, this is one of the first things worth checking.
Once imported, SigNoz will populate dashboards showing total proxy usage across all hosted and routed LLMs.
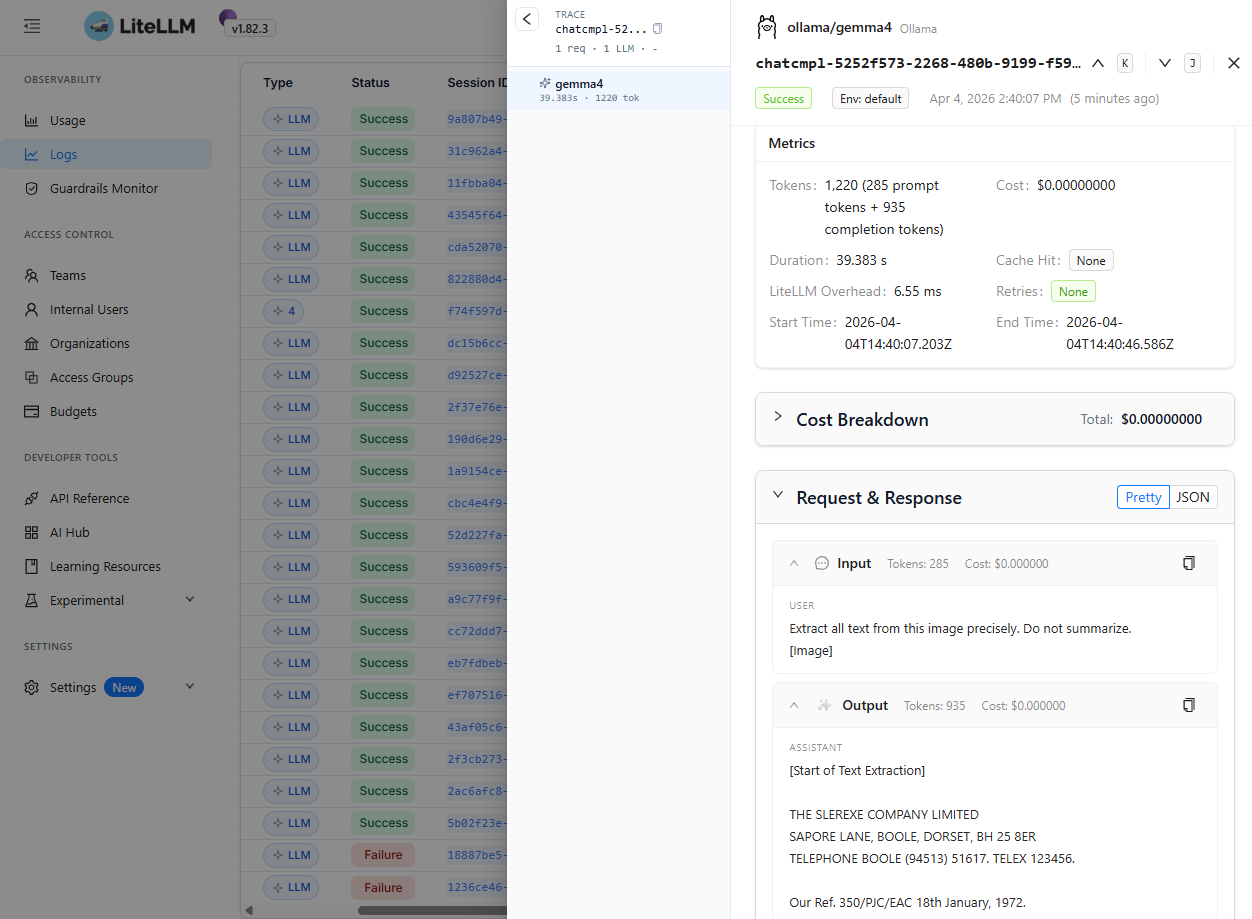
4. A Note on LiteLLM Logs
You may notice that the Logs tab in SigNoz remains empty even though the proxy is actively serving traffic.
This appears to be due to a known upstream issue in the official LiteLLM Docker images, where the opentelemetry-instrumentation package is not included by default (
BerriAI/litellm#22762
).
Without that package, the Python runtime cannot automatically bridge internal application logs into OTLP log records in the same way that traces and metrics are exported.
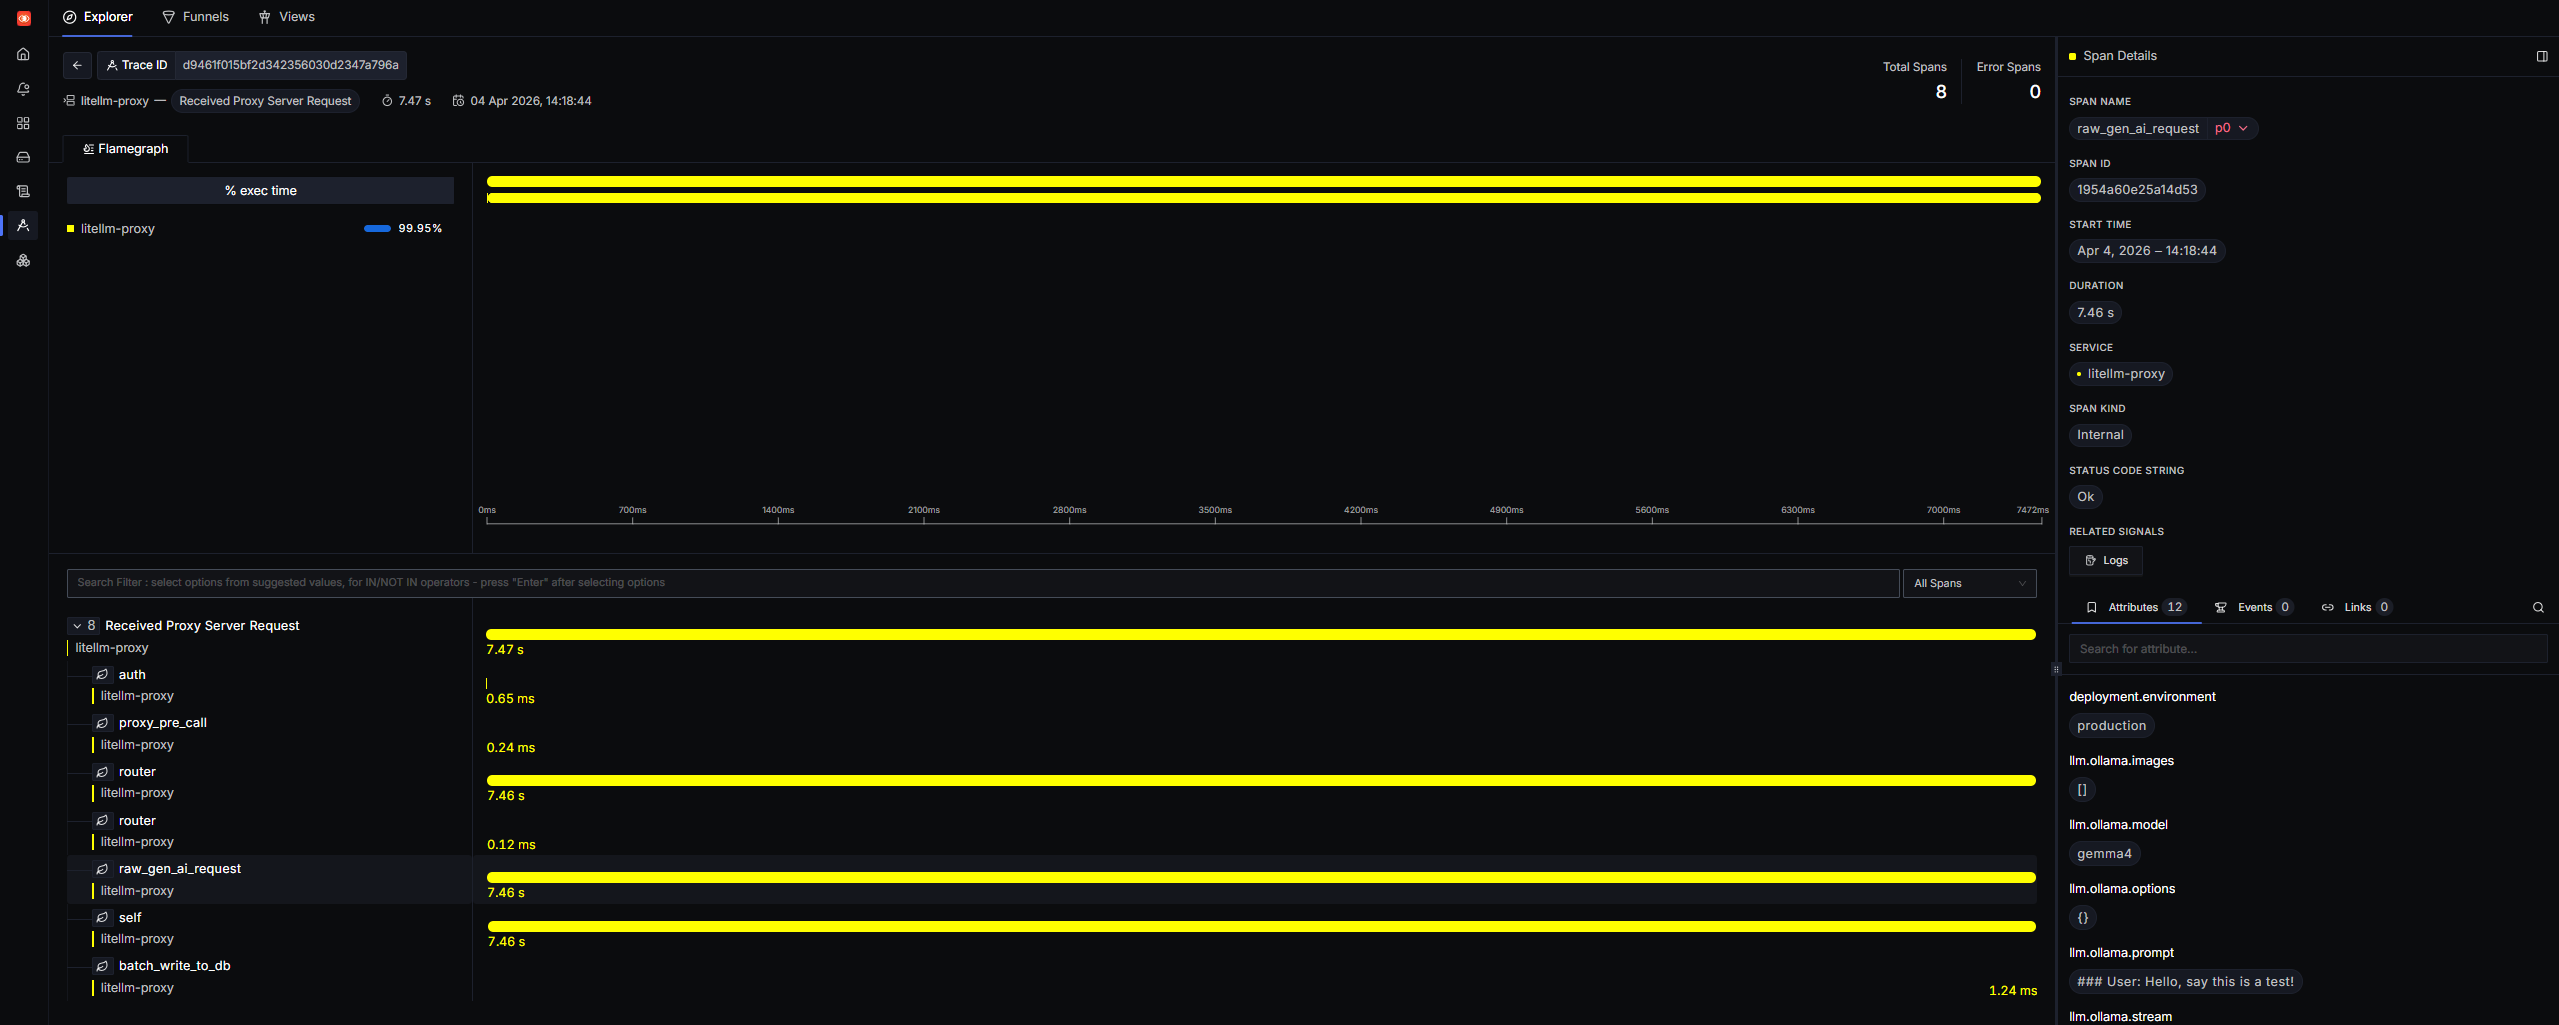
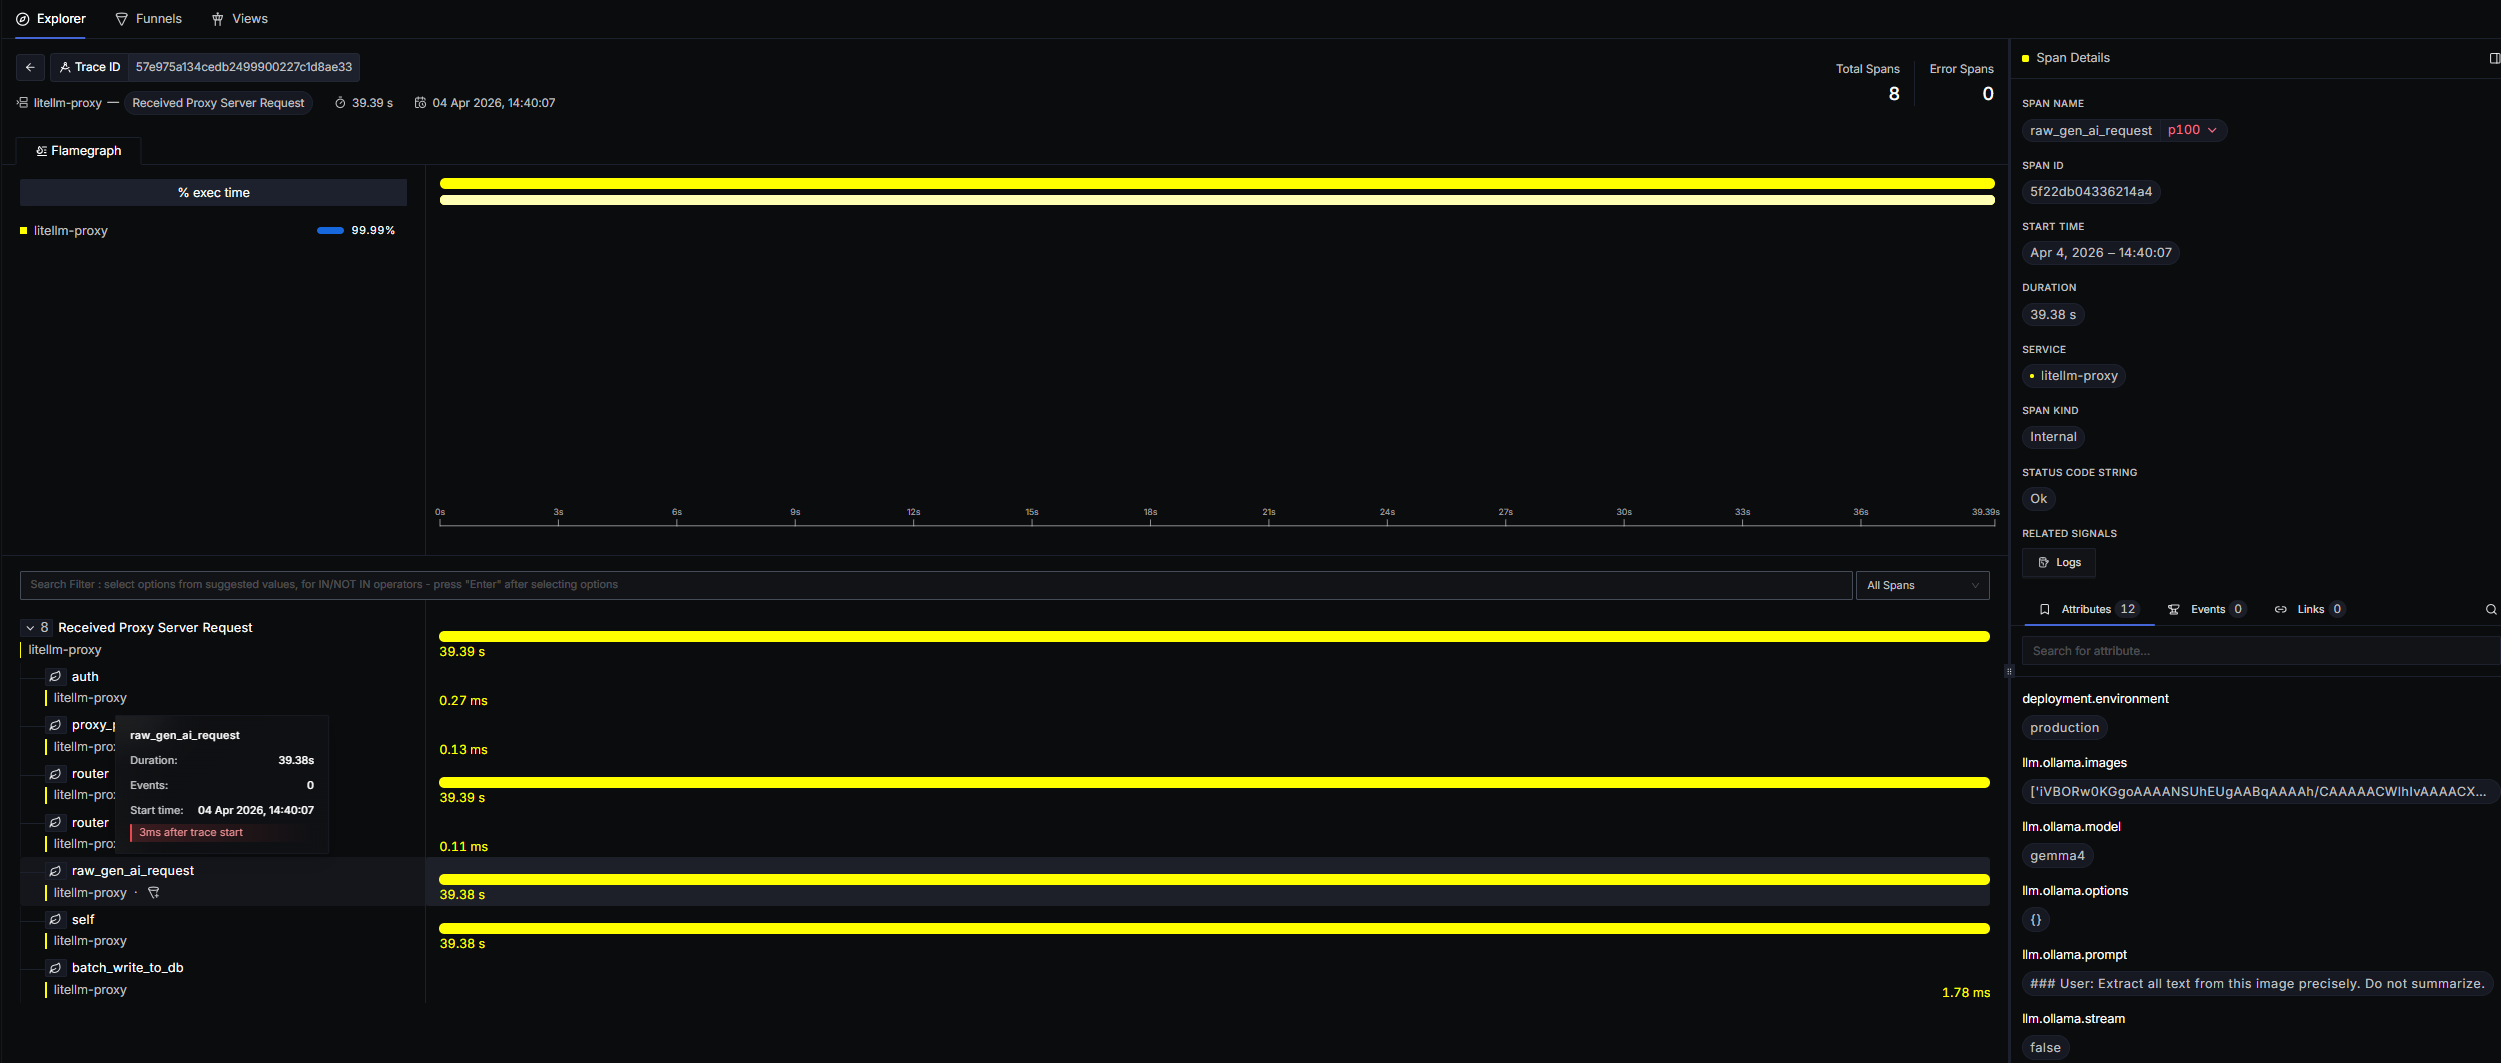
The good news: for AI observability, the missing Logs tab is usually not a blocker.
LiteLLM’s native otel callback already attaches the most useful request-level details directly to trace spans, including:
- prompt content
- completion output
- token usage
- model metadata
In practice, this means you can still inspect nearly everything you need by clicking into a span from the Trace Explorer.
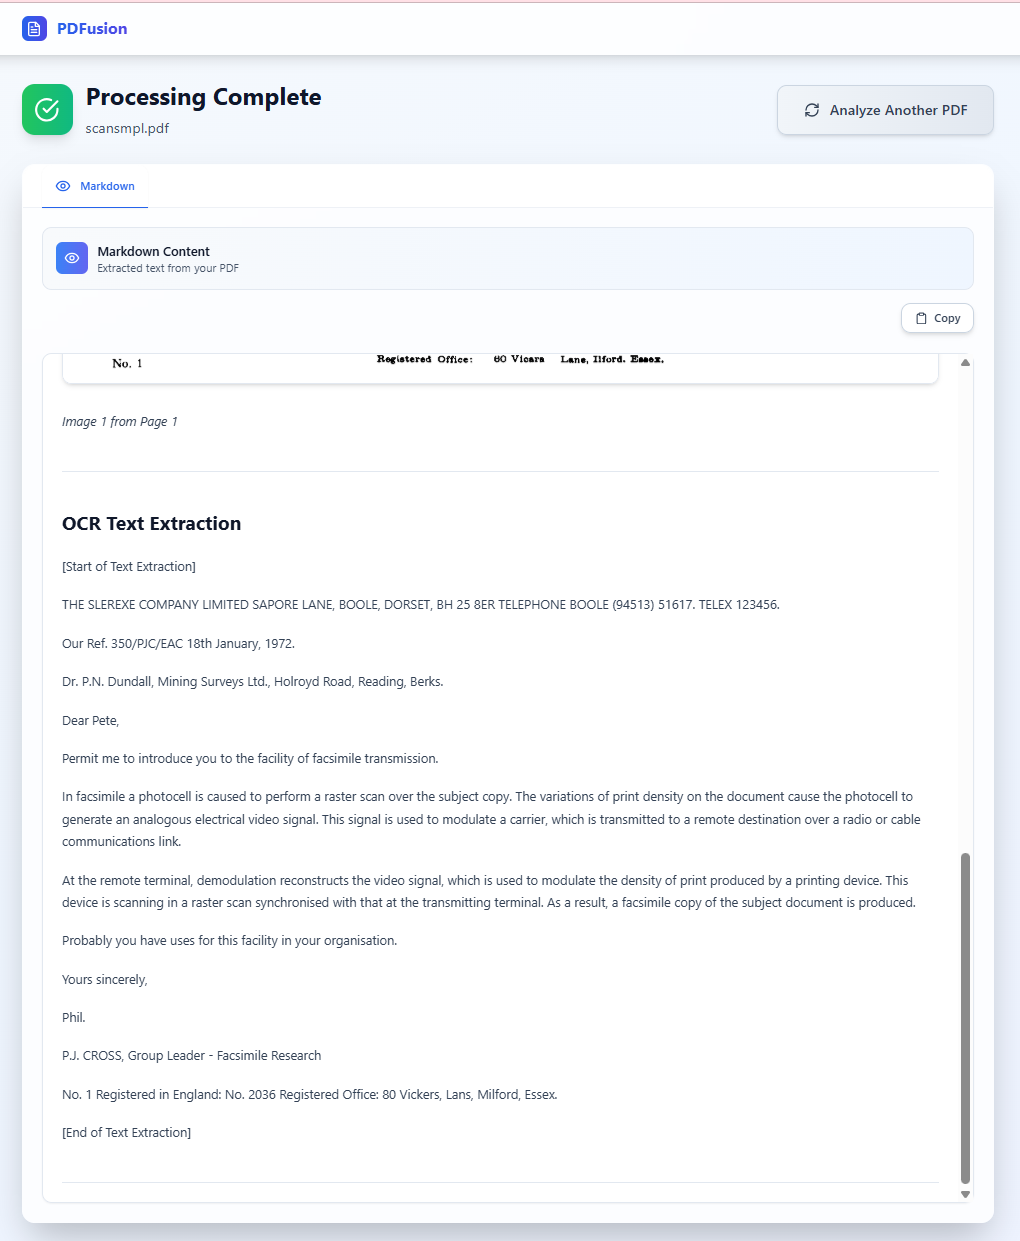
5. Processing OCR in PDFusion
To test the full application flow, I used this sample PDF and ran it through the OCR pipeline in PDFusion.
This is the resulting OCR text extraction flow:
A quick note on the model choice: I used gemma4 here because it is a recently released multimodal model in Ollama with native text + image support, making it a strong fit for OCR-oriented document workflows.
Ollama’s model guidance also notes that higher visual token budgets are better suited for OCR, document parsing, and reading small text, which maps nicely to PDFusion’s extraction pipeline.
Conclusion
This setup gives me a private, observable, and reasonably production-like AI platform inside the homelab.
By combining LiteLLM with SigNoz, every prompt, completion, and inference path becomes inspectable. That gives me the same kind of visibility into local AI workloads that teams typically expect from cloud-native observability platforms.
For projects like PDFusion, this is especially useful because it turns LLM calls from a “black box” into something traceable, measurable, and debuggable.