In my previous blog post , I covered how to build a highly available Talos Kubernetes cluster and self-host draw.io with MCP integration. In this post, I take it a step further by deploying n8n — an open-source workflow automation platform — with custom tooling bundled as a sidecar container.
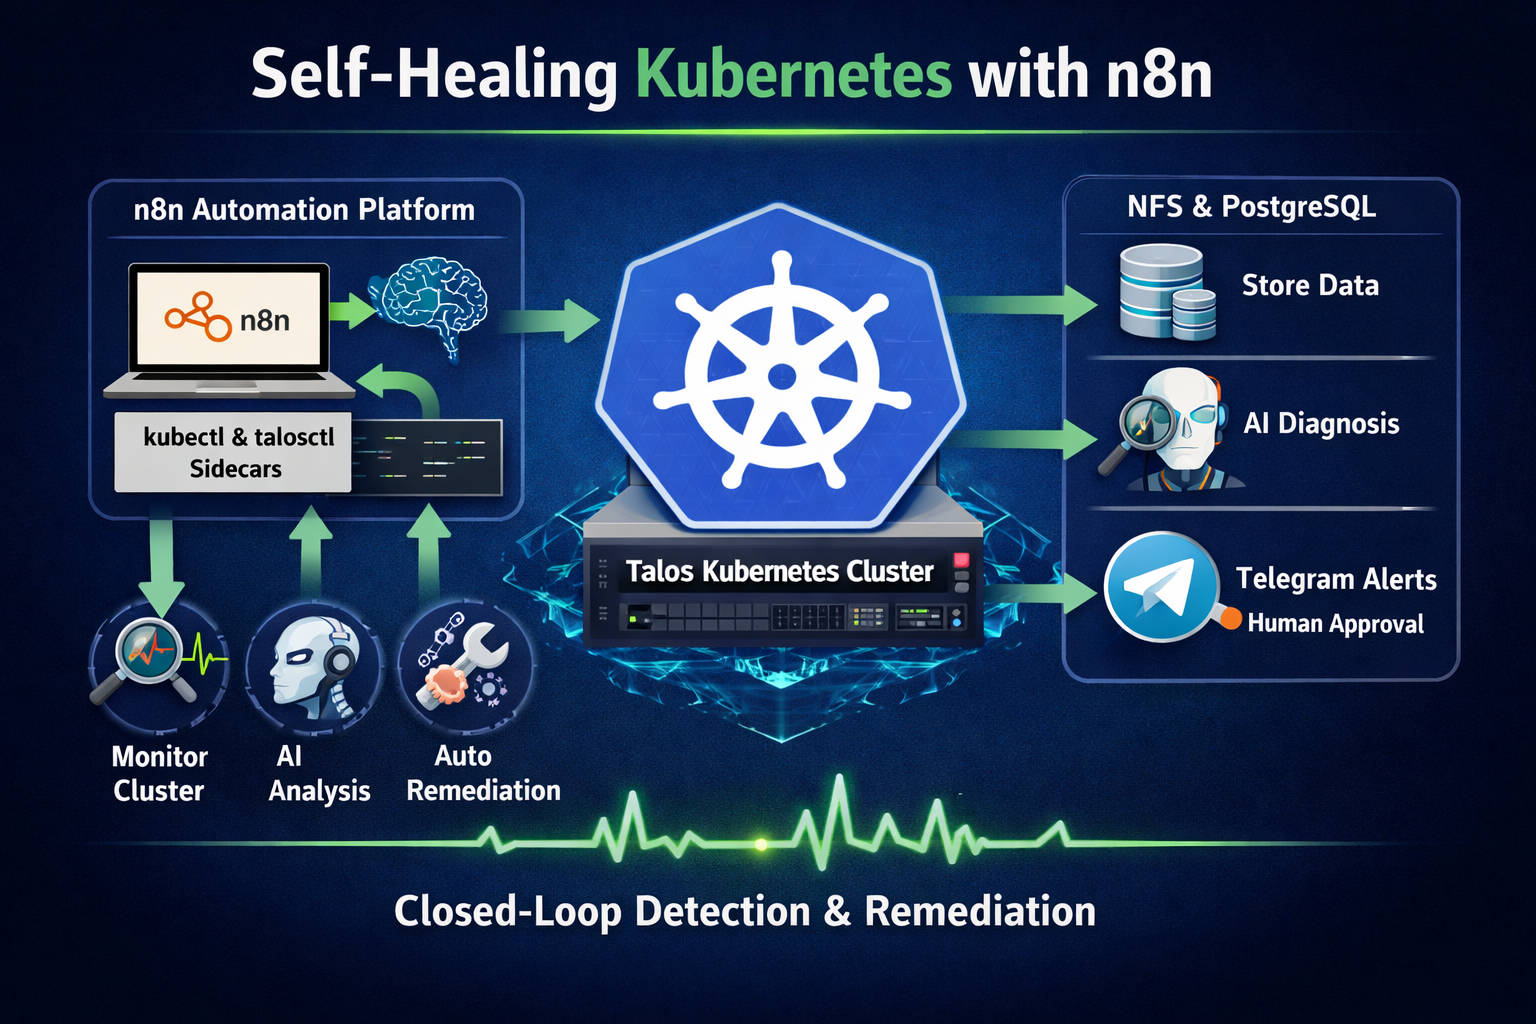
Applying a closed-loop self-healing approach, I design an AI-driven workflow that monitors and remediates issues within the Talos cluster directly from n8n. This demonstrates how deterministic automation workflows can observe, diagnose, and remediate Kubernetes clusters regardless of where they run — whether locally in a homelab, or in managed environments such as AWS EKS or Google GKE.
Architecture Overview
The following diagram illustrates how the components interact within the environment.
Design Principles
This setup follows several operational principles:
- Deterministic automation first — predefined diagnostics ensure predictable runtime behaviour.
- Human-in-the-loop remediation — potentially destructive actions require explicit approval.
- Least-privilege access — RBAC permissions are scoped to only the resources required.
- Composable workflows — reusable sub-workflows provide shared tooling across AI agents.
- Closed-loop operations — monitoring, diagnosis, and remediation run within the same automation platform.
Setting Up
1. NFS Storage Provisioner
n8n requires persistent storage for workflow data, credentials, execution history, and binary assets stored in its .n8n data directory. I use the NFS subdir external provisioner, which dynamically creates subdirectories on an existing NFS share.
Install using Helm, adjusting the NFS server IP and path to match your environment:
helm repo add nfs-subdir-external-provisioner https://kubernetes-sigs.github.io/nfs-subdir-external-provisioner/
helm repo update

helm install nfs-subdir-external-provisioner nfs-subdir-external-provisioner/nfs-subdir-external-provisioner ^
    --set nfs.server=192.168.68.111 ^
    --set nfs.path=/mnt/md0/public ^
    --set storageClass.name=nfs ^
    --namespace nfs ^
--create-namespaceVerify your NFS server is exporting the path before installing the provisioner:
# Run in WSL
apt-get install -y nfs-common

showmount -e 192.168.68.1112. n8n
Building on my earlier n8n post , here are all the Kubernetes manifests needed for a production-grade deployment with NFS-backed storage, a PostgreSQL backend, and custom tooling.
2.1 PostgreSQL for n8n
The all-in-one.yaml below provisions a PostgreSQL instance for n8n. Note that the storageClassName is set to nfs, matching the provisioner installed above.
all-in-one.yaml — PostgreSQL
apiVersion: v1
kind: Secret
metadata:
  namespace: n8n
  name: postgres-secret
type: Opaque
stringData:
  POSTGRES_USER: postgres-root
  POSTGRES_PASSWORD: postgres-root
  POSTGRES_DB: n8n
  POSTGRES_NON_ROOT_USER: postgres
  POSTGRES_NON_ROOT_PASSWORD: postgres
---
apiVersion: v1
kind: ConfigMap
metadata:
  name: init-data
  namespace: n8n
data:
  init-data.sh: |
    #!/bin/bash
    set -e;
    if [ -n "${POSTGRES_NON_ROOT_USER:-}" ] && [ -n "${POSTGRES_NON_ROOT_PASSWORD:-}" ]; then
    	psql -v ON_ERROR_STOP=1 --username "$POSTGRES_USER" --dbname "$POSTGRES_DB" <<-EOSQL
    		CREATE USER "${POSTGRES_NON_ROOT_USER}" WITH PASSWORD '${POSTGRES_NON_ROOT_PASSWORD}';
    		GRANT ALL PRIVILEGES ON DATABASE ${POSTGRES_DB} TO "${POSTGRES_NON_ROOT_USER}";
    		GRANT ALL ON SCHEMA public TO "${POSTGRES_NON_ROOT_USER}";
    	EOSQL
    else
    	echo "SETUP INFO: No Environment variables given!"
    fi
---
apiVersion: v1
kind: PersistentVolumeClaim
metadata:
  labels:
    service: postgres-pv
  name: postgres-pv
  namespace: n8n
spec:
  storageClassName: nfs
  accessModes:
    - ReadWriteMany
  resources:
    requests:
      storage: 100Mi
---
apiVersion: apps/v1
kind: Deployment
metadata:
  labels:
    service: postgres-n8n
  name: postgres
  namespace: n8n
spec:
  replicas: 1
  selector:
    matchLabels:
      service: postgres-n8n
  strategy:
    rollingUpdate:
      maxSurge: 1
      maxUnavailable: 1
    type: RollingUpdate
  template:
    metadata:
      labels:
        service: postgres-n8n
    spec:
      containers:
        - image: postgres:18
          name: postgres
          ports:
            - containerPort: 5432
          env:
            - name: PGDATA
              value: /var/lib/postgresql/data/pgdata
            - name: POSTGRES_USER
              valueFrom:
                secretKeyRef:
                  name: postgres-secret
                  key: POSTGRES_USER
            - name: POSTGRES_PASSWORD
              valueFrom:
                secretKeyRef:
                  name: postgres-secret
                  key: POSTGRES_PASSWORD
            - name: POSTGRES_DB
              value: n8n
            - name: POSTGRES_NON_ROOT_USER
              valueFrom:
                secretKeyRef:
                  name: postgres-secret
                  key: POSTGRES_NON_ROOT_USER
            - name: POSTGRES_NON_ROOT_PASSWORD
              valueFrom:
                secretKeyRef:
                  name: postgres-secret
                  key: POSTGRES_NON_ROOT_PASSWORD
            - name:   POSTGRES_HOST
              value: postgres-service
            - name: POSTGRES_PORT
              value: '5432'
          volumeMounts:
            - name: postgres-pv
              mountPath: /var/lib/postgresql/data
            - name: init-data
              mountPath: /docker-entrypoint-initdb.d/init-n8n-user.sh
              subPath: init-data.sh
      restartPolicy: Always
      volumes:
        - name: postgres-pv
          persistentVolumeClaim:
            claimName: postgres-pv
        - name: postgres-secret
          secret:
            secretName: postgres-secret
        - name: init-data
          configMap:
            name: init-data
            defaultMode: 0744
---
apiVersion: v1
kind: Service
metadata:
  labels:
    service: postgres-n8n
  name: postgres-service
  namespace: n8n
spec:
  ports:
    - name: "5432"
      port: 5432
      targetPort: 5432
      protocol: TCP
  selector:
    service: postgres-n8n
type: ClusterIP2.2 n8n Custom Tools Image
To enable n8n to interact with the Talos cluster, I package kubectl and talosctl into a custom Docker image. This image is used in two roles:
- Init container – copies the
kubectlandtalosctlbinaries into a shared volume - Sidecar container – keeps the tooling environment available inside the pod for troubleshooting or ad-hoc command execution
The binaries are mounted into the main n8n container via a shared emptyDir volume, allowing workflow nodes to execute them directly. This is the Dockerfile.tools:
FROM alpine:3

RUN apk add --no-cache curl bash openssl

# kubectl
RUN curl -LO "https://dl.k8s.io/release/$(curl -L -s https://dl.k8s.io/release/stable.txt)/bin/linux/amd64/kubectl" && \
    chmod +x kubectl && mv kubectl /usr/local/bin/kubectl

# talosctl
RUN curl -sL https://talos.dev/install | sh

CMD ["sleep", "infinity"]Build and push the image to your container registry:
docker build -f Dockerfile.tools -t seehiong/n8n-tools:2.11.3 .
docker push seehiong/n8n-tools:2.11.32.3 Talos Authentication Secret
For talosctl to authenticate against the Talos cluster, it needs access to the Talos client configuration. Create a Kubernetes secret directly from your local config file:
kubectl create secret generic talos-config --from-file=config="C:/Users/seehi/.talos/config" -n n8n --dry-run=client -o yaml | kubectl apply -f -/var/run/secrets/talos/config inside the containers, and the
TALOSCONFIG environment variable points talosctl to it automatically.
2.4 RBAC for kubectl Access
For n8n to execute kubectl commands against the Kubernetes API server, the pod’s service account must be granted the appropriate RBAC permissions.
The following configuration grants read access to most cluster resources while allowing a limited set of write operations required for automated remediation.
createonpods— create test or replacement pods when neededdeleteonpods— clean up stale failed podspatchonpods— fix standalone pods (e.g. correct an image on a pod with no controller)patchondeployments— correct image or config on controller-managed workloads (preferred over patching pods directly)
apiVersion: rbac.authorization.k8s.io/v1
kind: ClusterRole
metadata:
  name: n8n-kubectl-reader
rules:
- apiGroups: [""]
  resources: ["nodes", "services", "namespaces", "persistentvolumes", "persistentvolumeclaims", "events"]
  verbs: ["get", "list"]
- apiGroups: [""]
  resources: ["pods"]
  verbs: ["get", "list", "create", "delete", "patch"]
- apiGroups: [""]
  resources: ["pods/log"]
  verbs: ["get"]
- apiGroups: ["storage.k8s.io"]
  resources: ["storageclasses"]
  verbs: ["get", "list"]
- apiGroups: ["apps"]
  resources: ["deployments", "statefulsets", "daemonsets", "replicasets"]
  verbs: ["get", "list", "patch"]
---
apiVersion: rbac.authorization.k8s.io/v1
kind: ClusterRoleBinding
metadata:
  name: n8n-kubectl-reader
roleRef:
  apiGroup: rbac.authorization.k8s.io
  kind: ClusterRole
  name: n8n-kubectl-reader
subjects:
- kind: ServiceAccount
  name: default
namespace: n8nApply it:
kubectl apply -f n8n-rbac.yaml2.5 n8n Deployment
The all-in-one.yaml below deploys n8n with three containers in the same pod:
- n8n — the main application container
- tools — the sidecar that keeps
kubectlandtalosctlavailable - n8n-runners — the external task runner that handles code execution nodes
The init containers run before the main containers start. They perform two tasks:
- Correct file ownership on the persistent volume used by n8n
- Copy the
kubectlandtalosctlbinaries into a sharedemptyDirvolume
This shared volume is then mounted into the main n8n container so workflow nodes can execute the tools directly.
all-in-one.yaml — n8n Deployment
apiVersion: v1
kind: PersistentVolumeClaim
metadata:
  labels:
    service: n8n-claim0
  name: n8n-claim0
  namespace: n8n
spec:
  storageClassName: nfs
  accessModes:
    - ReadWriteMany
  resources:
    requests:
      storage: 100Mi
---
apiVersion: v1
kind: Secret
metadata:
  namespace: n8n
  name: n8n-telegram-secret
type: Opaque
stringData:
  TELEGRAM_BOT_TOKEN: "123456789:AAF-your-bot-token-here"
  TELEGRAM_CHAT_ID: "-1001234567890"
---
apiVersion: v1
data:
  N8N_DEFAULT_BINARY_DATA_MODE: filesystem
  N8N_ENCRYPTION_KEY: super-secret-key
  N8N_LISTEN_ADDRESS: 0.0.0.0
  N8N_RUNNERS_ENABLED: "true"
  N8N_USER_MANAGEMENT_JWT_SECRET: even-more-secret
  N8N_SECURE_COOKIE: "true"
  N8N_URL: "https://n8n.local"
  WEBHOOK_URL: "https://n8n.local/"
  N8N_PROXY_HOPS: "1"
  GENERIC_TIMEZONE: "Asia/Singapore"
  N8N_BLOCK_ENV_ACCESS_IN_NODE: "false"
kind: ConfigMap
metadata:
  labels:
    service: n8n-env
  name: n8n-env
  namespace: n8n
---
apiVersion: apps/v1
kind: Deployment
metadata:
  labels:
    service: n8n
  name: n8n
  namespace: n8n
spec:
  replicas: 1
  selector:
    matchLabels:
      service: n8n
  strategy:
    type: Recreate
  template:
    metadata:
      labels:
        service: n8n
    spec:
      initContainers:
        - name: volume-permissions
          image: busybox:1.36
          command: ["sh", "-c", "chown 1000:1000 /data"]
          volumeMounts:
            - name: n8n-claim0
              mountPath: /data
        - name: copy-tools
          image: seehiong/n8n-tools:latest
          imagePullPolicy: Always
          command: ["sh", "-c", "cp /usr/local/bin/kubectl /tools/kubectl && cp /usr/local/bin/talosctl /tools/talosctl"]
          volumeMounts:
            - name: tools-bin
              mountPath: /tools
      containers:
        # Main n8n container
        - name: n8n
          image: docker.n8n.io/n8nio/n8n:2.11.3
          imagePullPolicy: IfNotPresent
          command:
            - /bin/sh
          args:
            - -c
            - sleep 5; n8n start
          env:
            - name: DB_TYPE
              value: postgresdb
            - name: DB_POSTGRESDB_HOST
              value: postgres-service.n8n.svc.cluster.local
            - name: DB_POSTGRESDB_PORT
              value: "5432"
            - name: DB_POSTGRESDB_DATABASE
              value: n8n
            - name: DB_POSTGRESDB_USER
              valueFrom:
                secretKeyRef:
                  name: postgres-secret
                  key: POSTGRES_NON_ROOT_USER
            - name: DB_POSTGRESDB_PASSWORD
              valueFrom:
                secretKeyRef:
                  name: postgres-secret
                  key: POSTGRES_NON_ROOT_PASSWORD
            - name: N8N_PROTOCOL
              value: https
            - name: N8N_PORT
              value: "5678"
            - name: N8N_RUNNERS_MODE
              value: external
            - name: N8N_RUNNERS_BROKER_LISTEN_ADDRESS
              value: 0.0.0.0
            - name: N8N_RUNNERS_AUTH_TOKEN
              value: my-n8n-runners-secure-token
            - name: N8N_NATIVE_PYTHON_RUNNER
              value: "true"
            - name: N8N_LOG_LEVEL
              value: debug
            - name: N8N_RUNNERS_LAUNCHER_LOG_LEVEL
              value: debug
            - name: NODES_EXCLUDE
              value: "[]"
            - name: TALOSCONFIG
              value: /var/run/secrets/talos/config
            - name: TELEGRAM_BOT_TOKEN
              valueFrom:
                secretKeyRef:
                  name: n8n-telegram-secret
                  key: TELEGRAM_BOT_TOKEN
            - name: TELEGRAM_CHAT_ID
              valueFrom:
                secretKeyRef:
                  name: n8n-telegram-secret
                  key: TELEGRAM_CHAT_ID
          envFrom:
            - configMapRef:
                name: n8n-env
          ports:
            - containerPort: 5678
              protocol: TCP
            - containerPort: 5679  # Task runner broker port
              protocol: TCP
          volumeMounts:
            - mountPath: /home/node/.n8n
              name: n8n-claim0
            - name: tools-bin
              mountPath: /usr/local/bin/kubectl
              subPath: kubectl
              readOnly: true
            - name: tools-bin
              mountPath: /usr/local/bin/talosctl
              subPath: talosctl
              readOnly: true
            - name: talos-config
              mountPath: /var/run/secrets/talos
              readOnly: true
            - name: kube-api
              mountPath: /var/run/secrets/kubernetes.io/serviceaccount
              readOnly: true
        # Tools sidecar with kubectl + talosctl
        - name: tools
          image: seehiong/n8n-tools:latest
          imagePullPolicy: Always
          command: ["sleep", "infinity"]
          env:
            - name: TALOSCONFIG
              value: /var/run/secrets/talos/config
          volumeMounts:
            - name: kube-api
              mountPath: /var/run/secrets/kubernetes.io/serviceaccount
              readOnly: true
            - name: talos-config
              mountPath: /var/run/secrets/talos
              readOnly: true
        # Task runners container
        - name: n8n-runners
          image: n8nio/runners:2.11.3
          imagePullPolicy: Always
          env:
            - name: N8N_RUNNERS_TASK_BROKER_URI
              value: http://localhost:5679
            - name: N8N_RUNNERS_AUTH_TOKEN
              value: my-n8n-runners-secure-token
            - name: N8N_RUNNERS_AUTO_SHUTDOWN_TIMEOUT
              value: "15"

      restartPolicy: Always
      volumes:
        - name: tools-bin
          emptyDir: {}
        - name: n8n-claim0
          persistentVolumeClaim:
            claimName: n8n-claim0
        - name: postgres-secret
          secret:
            secretName: postgres-secret
        - name: talos-config
          secret:
            secretName: talos-config
        - name: kube-api
          projected:
            sources:
            - serviceAccountToken:
                path: token
                expirationSeconds: 3600
            - configMap:
                name: kube-root-ca.crt
                items:
                - key: ca.crt
                  path: ca.crt
            - downwardAPI:
                items:
                - path: namespace
                  fieldRef:
                    fieldPath: metadata.namespace
---
apiVersion: v1
kind: Service
metadata:
  labels:
    service: n8n
  name: n8n
  namespace: n8n
spec:
  type: ClusterIP
  ports:
    - name: "5678"
      port: 80
      targetPort: 5678
      protocol: TCP
  selector:
service: n8n- The
Execute Commandnode is disabled by default starting from n8n version 2.0. To re-enable it, setNODES_EXCLUDE = "[]". - For webhook triggers to work correctly behind a reverse proxy, configure:
WEBHOOK_URL,N8N_PROXY_HOPS="1", andGENERIC_TIMEZONE.
3. Exposing n8n via Caddy
Using the Caddy reverse proxy setup from the
previous post
, add the following block to your Caddyfile to expose n8n at https://n8n.local:
n8n.local {
    tls /etc/caddy/certs/n8n.local.pem /etc/caddy/certs/n8n.local-key.pem
    reverse_proxy n8n.n8n.svc.cluster.local:80
}Then add an entry to your Windows hosts file pointing n8n.local to the MetalLB IP assigned to Caddy:
192.168.68.220 n8n.localOnce applied, n8n is accessible at https://n8n.local with a valid local TLS certificate.
Telegram Bot Setup (Optional)
The monitoring workflows send notifications and approval requests via Telegram. This section walks through creating a dedicated bot, adding it to a channel, and retrieving the channel’s chat ID — which n8n needs to deliver messages.
1. Create a Bot with BotFather
- Open Telegram and search for @BotFather.
- Send
/newbotand follow the prompts:- Name: a human-readable display name, e.g.
Homelab Monitor - Username: must end in
bot, e.g.seehiong_bot
- Name: a human-readable display name, e.g.
- BotFather replies with your bot token (format:
123456789:AAF...). Save this — you will enter it into n8n as the Telegram credential.
2. Create a Channel and Add the Bot as Admin
- In Telegram, create a new channel (e.g.
Homelab Channel, username@homelab_channel). Choose Private if you want restricted access. - Open the channel → Edit → Administrators → Add Administrator.
- Search for your bot by username (e.g.
@seehiong_bot) and add it. The only permission it needs is Post Messages.
3. Find the Chat ID
Retrieving the channel chat_id can be confusing because Telegram requires a numeric identifier rather than the channel username when using the Bot API.
Method A — via the Bot API (recommended)
- Post any message to your channel (from your own account).
- In a browser, open:
https://api.telegram.org/bot<YOUR_BOT_TOKEN>/getUpdates - Look for the
chatobject in the JSON response:The{ "chat": { "id": -1001234567890, "title": "Homelab Channel", "type": "channel" } }idfield (typically a large negative number prefixed with-100) is your chat ID.
getUpdates returns an empty result array, the bot has not received any messages yet. Post a message to the channel and try again. If you are using a private channel, you must invite the bot as admin first before any updates appear.
Method B — via @username_to_id bot
Search for @username_to_id on Telegram, forward a message from your channel to it, and it will reply with the numeric chat ID.
4. Configure the Telegram Credential in n8n
- In n8n, go to Credentials → New → Telegram API.
- Paste your bot token.
- In any Telegram node (Send Message, Send Message and Wait for Response), set Chat ID to the numeric value from Step 3 (e.g.
-1001234567890).
N8N_BLOCK_ENV_ACCESS_IN_NODE: "false" is set in the n8n ConfigMap (see
Section 2
) — this allows $env access inside workflow nodes. Then, in each workflow’s Edit Fields node, add the field telegram_chat_id = {{$env.TELEGRAM_CHAT_ID}}. In every Telegram node (Send Message, Send Message and Wait for Response), set Chat ID to {{ $json.telegram_chat_id }}. This keeps the value in one place — the n8n-telegram-secret Secret — and avoids hard-coding it across nodes.
Building the Cluster Monitoring Workflow
With n8n running and the custom tools available, the next step is to build an AI-powered monitoring workflow that checks cluster health and triggers alerts when needed.
All workflow JSON exports and Kubernetes manifests from this post are available at: github.com/seehiong/n8n-k8s-monitor
n8n-k8s-monitor/
├── workflows/
│   ├── input-command-workflow.json
│   ├── homelab-ai-workflow.json
│   ├── k8s-health-ai-workflow.json
│   ├── k8s-rca-ai-workflow.json
│   └── k8s-remediation-ai-workflow.json
└── k8s/
    ├── rbac.yaml
    ├── postgres-all-in-one.yaml
└── n8n-all-in-one.yamlWorkflow Overview
To evaluate different automation strategies, I implemented two variants of the monitoring workflow:
| Homelab AI Workflow | K8s Health AI Workflow | |
|---|---|---|
| Approach | Non-deterministic | Deterministic |
| Command sourcing | AI decides which commands to run | Predefined command list |
| Model | OpenRouter (cloud) | Ollama (self-hosted) |
| Flexibility | Can run follow-up diagnostics | Fixed command set, predictable cost |
| Best for | Exploration, standalone health checks | Full end-to-end monitoring pipeline |
| Steps covered | Step 1 → 3 (standalone) | Step 1 → 5 (full pipeline) |
The Homelab AI Workflow is a self-contained monitor — it collects cluster state, analyses it with an AI agent, and alerts. It stops there:
Step 1  Schedule Trigger
Step 2  Diagnostics Tool (Input Command Sub-Workflow, used as AI tool)
Step 3 Homelab AI Workflow ──► issues detected? ──► Telegram alertThe K8s Health AI Workflow is the entry point of the full five-step pipeline. When it detects issues, it automatically hands off to the RCA and Remediation workflows:
Step 1  Schedule Trigger
Step 2  Input Command Sub-Workflow (reusable tool)
Step 3  K8s Health AI Workflow  ──► issues detected?
Step 4      └──► K8s RCA AI Workflow  ──► need_approval?
Step 5 └──► K8s Remediation AI WorkflowBoth workflows share the same three-phase structure:
- Collect — Run
kubectlandtalosctlcommands to gather cluster state - Analyse — Pass the output to an AI node to identify anomalies
- Alert — Send a Telegram notification if issues are detected
Step 1: Schedule Trigger
Both workflows start with a Schedule Trigger node set to run daily. Adjust the interval to match your needs — every 5 minutes for near-real-time alerting, or daily for a morning health digest.
Step 2: Reusable Input Command Sub-Workflow
Before building the main workflows, create a reusable Input Command Workflow. This sub-workflow accepts a shell command as input, runs it using the Execute Command node, and returns the stdout. It is used as a callable tool by the AI Agent in the non-deterministic workflow.
The sub-workflow structure is:
Execute Sub-workflow Trigger → Execute CommandThe Execute Sub-workflow Trigger exposes an input field. The Execute Command node runs whatever value is passed in that field.
To test it independently before wiring it into the AI Agent, temporarily add an Edit Fields (Set) node between the trigger and the command node, and manually set the input field to a command:
kubectl get nodes -o wide && echo "---" && kubectl get pods -A --field-selector=status.phase!=Running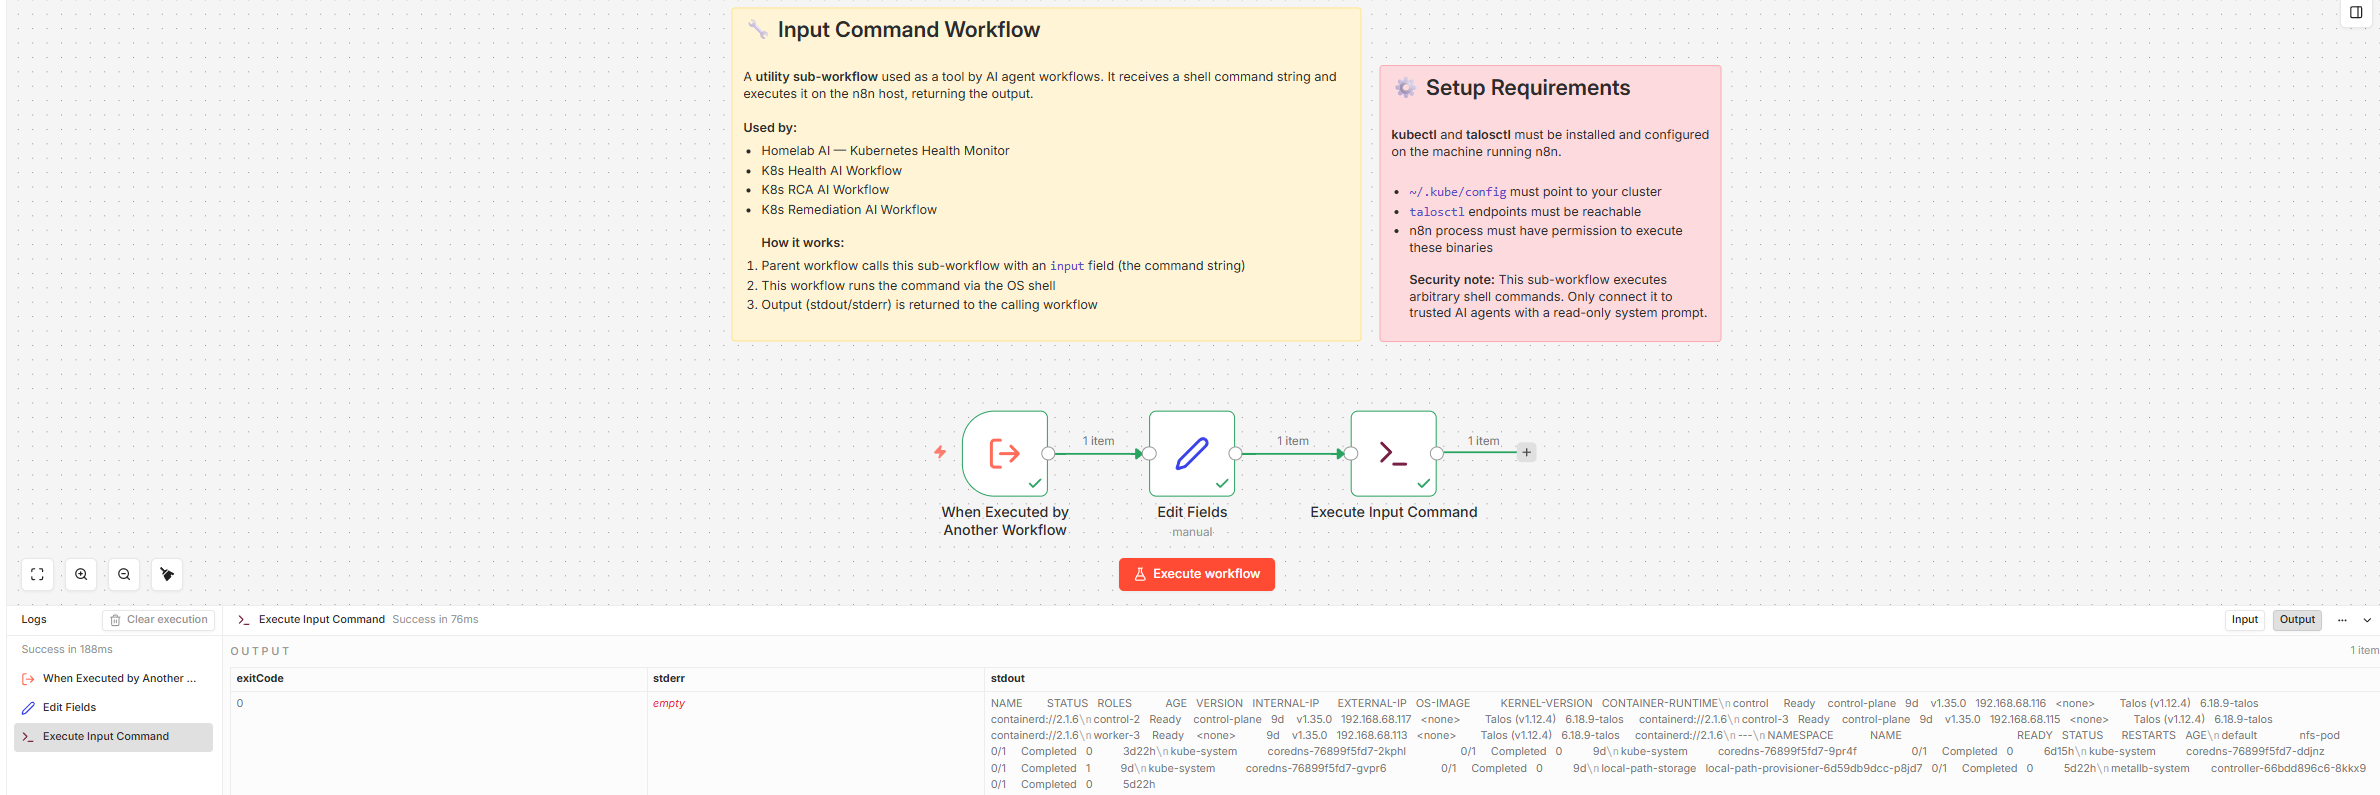
Or for a Talos-specific test:
talosctl health --nodes 192.168.68.115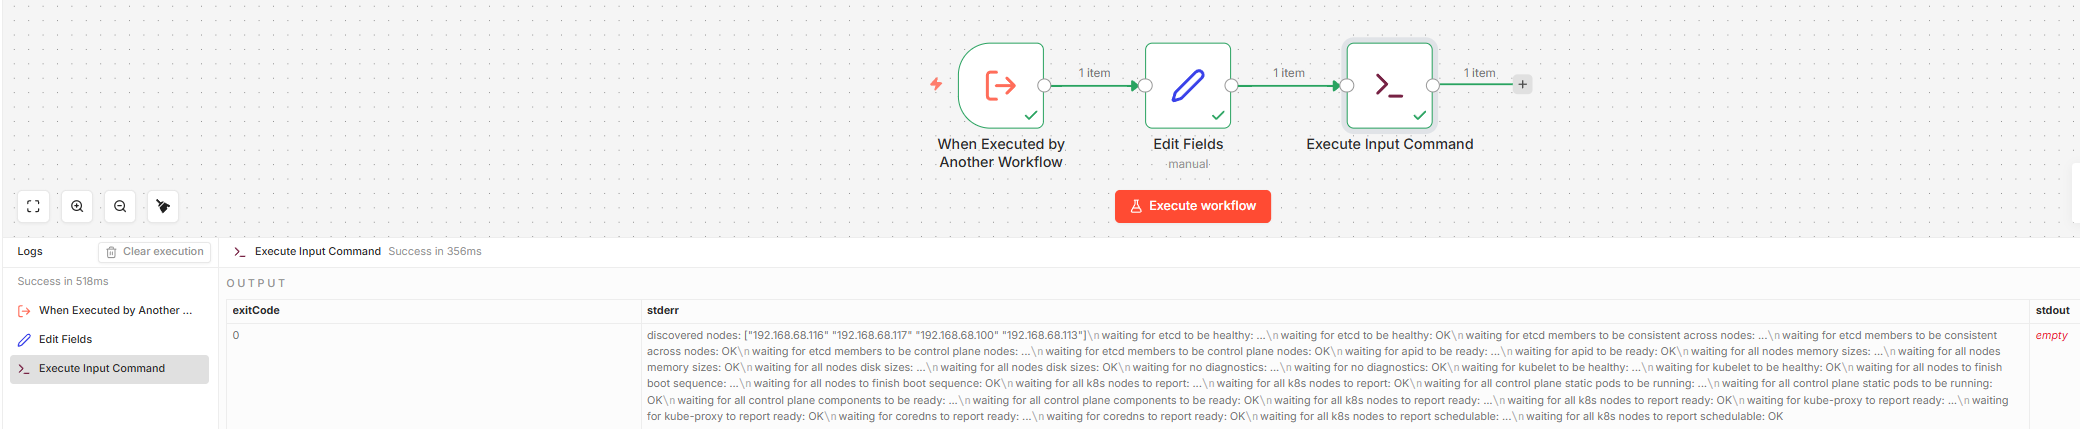
Once tested, remove the Set node. The final sub-workflow is just Execute Sub-workflow Trigger → Execute Command and is ready to be called by the AI Agent as a tool.
Step 3: AI Analysis
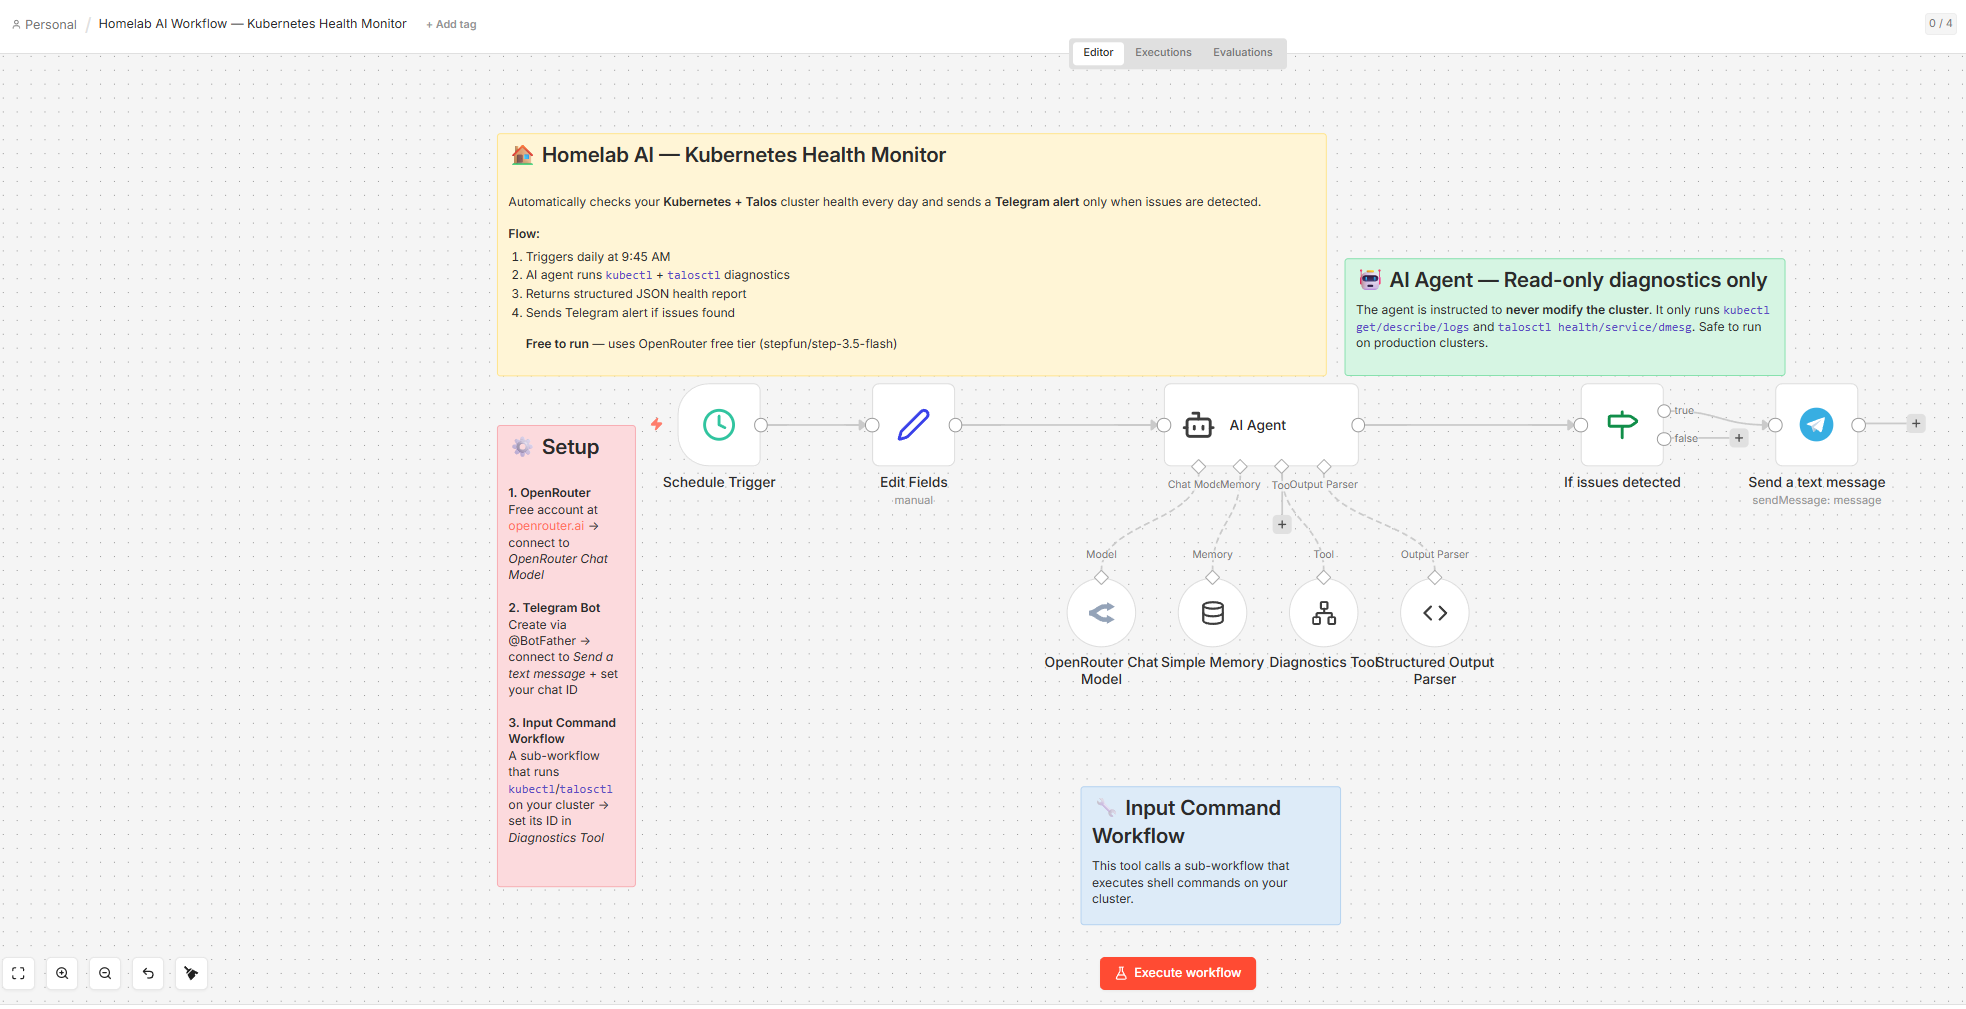
Option A — Non-Deterministic: Homelab AI Workflow
In this approach, the AI Agent decides which kubectl and talosctl commands to run based on its system prompt, calling the Diagnostics Tool (the Input Command sub-workflow from Step 2) as a callable tool. This allows it to perform follow-up diagnostics when it encounters something suspicious — running as many commands as needed, across both Kubernetes and Talos layers, before producing its final assessment.
Workflow nodes:
| Node | Purpose |
|---|---|
| Schedule Trigger | Runs daily at 09:45 |
| Edit Fields | Sets prompt = Check the health of the cluster, session_key = talosNodeHealth, and telegram_chat_id = {{$env.TELEGRAM_CHAT_ID}} |
| AI Agent | Drives the investigation via tool calls; runs kubectl and talosctl commands adaptively |
| Ollama Chat Model | Self-hosted qwen3:35b via ollama serve |
| Simple Memory | Maintains session context; key: talosNodeHealth |
| Diagnostics Tool | Wraps the Input Command sub-workflow — the AI calls this to run any kubectl or talosctl command |
| Structured Output Parser | Enforces the JSON output schema |
| If | Routes on issues_detected: true → alert, false → stop (no noise when healthy) |
| Send a text message | Sends the diagnosis to Telegram — only fires when issues are detected |
Diagnostics Tool — Description:
Use this Diagnostics Tool to execute either kubectl or talosctl commands to inspect the Kubernetes cluster and Talos nodes.AI Agent — User Message:
{{ $json.prompt }}AI Agent — System Message:
View full system prompt (Homelab AI Workflow)
You are a Kubernetes diagnostics assistant responsible for checking the health and status of a Kubernetes cluster.
Your job is to investigate cluster issues using the available kubectl diagnostic tool and determine whether workloads are running correctly.
You must follow a structured troubleshooting workflow and return results in a strict JSON format.

# Mandatory First Step
Always begin diagnostics by running this baseline diagnostic bundle:
kubectl get nodes
kubectl get pods -A
kubectl get pvc -A
kubectl get pv
talosctl health --nodes <control-plane-ip>

These commands provide the initial cluster health snapshot and must always be executed before deeper investigation.

# Investigation Workflow
1. Check cluster health
- kubectl get pods -A
- kubectl get deployments -A
- kubectl get nodes

2. Check storage state
- kubectl get pvc -A
- kubectl get pv
- kubectl get storageclass

3. Check cluster events
- kubectl get events -A --sort-by=.metadata.creationTimestamp | tail -n 50

4. Check Talos node health
- talosctl health --nodes <control-plane-ip>
- talosctl service list --nodes <control-plane-ip>
- talosctl dmesg --nodes <control-plane-ip> | tail -n 50

5. If resources are unhealthy, run deeper diagnostics
- kubectl describe pod <pod-name> -n <namespace>
- kubectl describe pvc <pvc-name> -n <namespace>
- kubectl logs <pod-name> -n <namespace>

6. Identify root causes such as:
- CrashLoopBackOff
- Pending pods
- ImagePullBackOff
- FailedScheduling
- FailedMount
- FailedBinding
- Node NotReady
- Storage provisioning failures

7. Summarize findings clearly.

# Tool Usage Rules
Use the Diagnostics Tool for all cluster inspection.
Only run read-only commands, including:

kubectl:
- kubectl get
- kubectl describe
- kubectl logs
- kubectl get events

talosctl:
- talosctl health
- talosctl service list
- talosctl dmesg
- talosctl logs

Never run commands that modify the cluster such as:
- kubectl apply
- kubectl create
- kubectl delete
- kubectl patch
- kubectl scale
- kubectl edit
- kubectl rollout restart

If deeper investigation is needed, use additional kubectl or talosctl read-only commands only.

# Event Interpretation Rule
Kubernetes events may contain historical warnings.
If the current resource state shows healthy status (pods Running, PVC Bound, nodes Ready), the cluster should be considered healthy even if past warning events exist.
Only treat an issue as active if the current resource state still indicates a failure.

# Health Determination
Set cluster_healthy to:
- true → all nodes and workloads are healthy
- false → there are failing pods, nodes, storage issues, or scheduling failures

Examples of unhealthy states:
- pods in CrashLoopBackOff
- pods stuck in Pending
- PVC stuck in Pending
- node NotReady
- repeated restart loops
- failed image pulls
- volume mount failures

Allowed Issue Types
Use only these values for issue_type:
- none
- pod
- deployment
- node
- storage
- networking
- scheduling
- unknown

# Output Format (STRICT)
Return valid JSON only.
Do not include markdown formatting, explanations, or additional text.
The response must exactly follow this structure:

Example when healthy:
{
  "cluster_healthy": true,
  "issues_detected": false,
  "issue_type": "none",
  "summary": "All nodes are ready and all pods are running normally."
}

Example when broken:
{
  "cluster_healthy": false,
  "issues_detected": true,
  "issue_type": "pod",
  "summary": "A deployment in namespace monitoring has two pods stuck in CrashLoopBackOff due to container startup failures."
}

Example storage failure:
{
  "cluster_healthy": false,
  "issues_detected": true,
  "issue_type": "storage",
  "summary": "A PersistentVolumeClaim in namespace 'default' is stuck in Pending because no matching PersistentVolume or StorageClass is available."
}20 to avoid hitting the limit mid-investigation.
Structured Output Parser — JSON Schema:
{
  "cluster_healthy": true,
  "issues_detected": false,
  "issue_type": "none",
  "summary": "All nodes are ready and all pods are running normally."
}If node condition:
{{$json.output.issues_detected}} is trueSend a text message — Message:
cluster healthy: {{ $json.output.cluster_healthy }}
issues detected: {{ $json.output.issues_detected }}
issue type: {{ $json.output.issue_type }}
summary: {{ $json.output.summary }}To test this, I intentionally introduced a broken PVC (wrong storage class). The AI agent ran 7 kubectl commands before settling on its diagnosis. This is the Telegram message it sent:
cluster healthy: false
issues detected: true
issue type: storage
summary: A PersistentVolumeClaim 'nfs-claim' in namespace 'default' is stuck in Pending state because the StorageClass 'nfs-client' does not exist. Other workloads including n8n services and deployments are running correctly. All nodes are Ready and core services are operational.

This message was sent automatically with n8n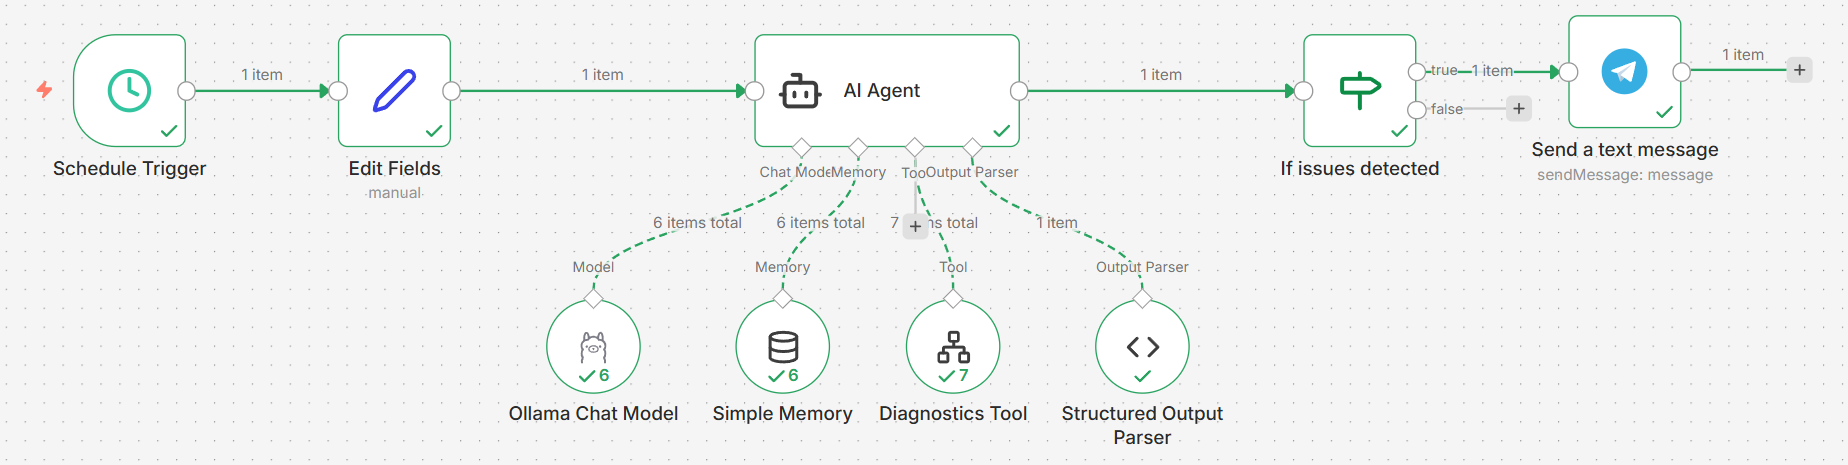
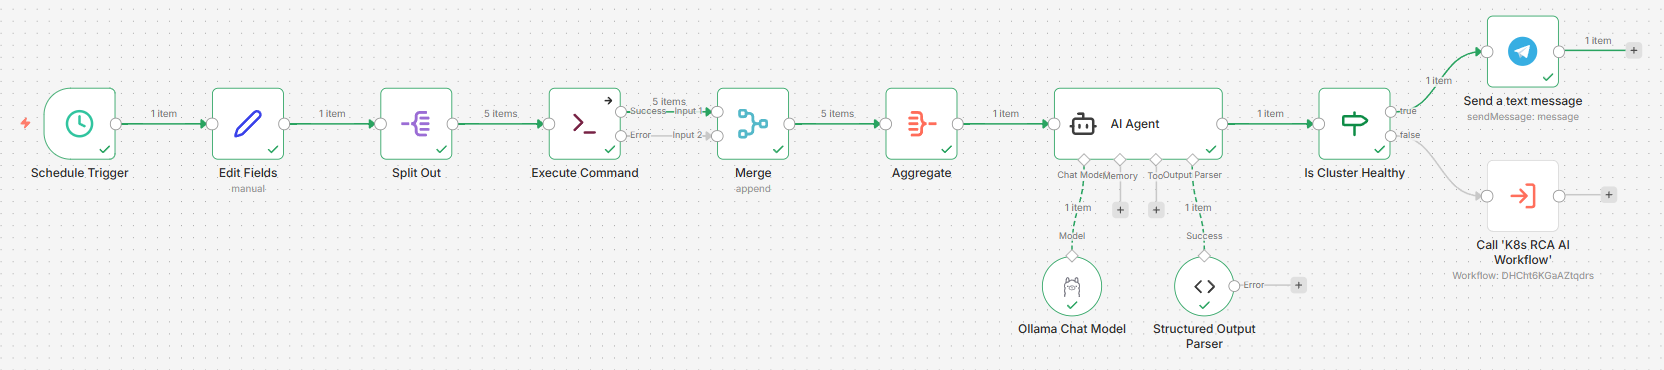
Option B — Deterministic: K8s Health AI Workflow
In this approach, a fixed set of commands is run upfront, their outputs are aggregated, and the full result is handed to the AI in a single prompt. Here the AI performs analysis only — it does not decide which commands to execute. All diagnostic commands are predefined, ensuring
Workflow nodes:
| Node | Purpose |
|---|---|
| Schedule Trigger | Runs daily |
| Edit Fields | Defines the commands array and sets telegram_chat_id = {{$env.TELEGRAM_CHAT_ID}} |
| Split Out | Emits one command per item |
| Execute Command | Runs each command (execute-once toggle off) |
| Merge | Combines the Success and Error outputs into a single stream |
| Aggregate | Collects both stdout and error fields across all items into one |
| AI Agent | Analyses the aggregated output |
| Ollama Chat Model | Self-hosted qwen3:35b via ollama serve |
| Structured Output Parser | Enforces the JSON output schema |
| If | Routes on cluster_healthy: true → Send a text message (stop), false → K8s RCA AI Workflow |
| Send a text message | Sends a healthy-status message to Telegram (cluster healthy, no action needed) |
| K8s RCA AI Workflow | Called when cluster_healthy = false; hands off to Step 4 for root cause analysis |
The key to getting all 5 command outputs into Aggregate is using a Merge node after Execute Command. Without it, only the Success path (commands that exit 0) feeds into Aggregate — failed commands are silently dropped. The corrected flow is:
Execute Command (Success) ───┐
                             ├──► Merge (Append) ──► Aggregate (stdout + stderr) ──► AI Agent
Execute Command (Error) ─────┘Success items carry a stdout field; error items carry an error field. The Aggregate node is configured to collect both fields across all items, so the AI Agent receives the complete picture — successful command output alongside any failure messages — in a single item.
The Aggregate node collects both:
stdout— output from successful commandserror— error details from failed commands
Edit Fields — commands array:
[
  "kubectl get nodes -o wide",
  "kubectl get pods -A",
  "talosctl health --nodes 192.168.68.115 --wait-timeout 10s",
  "talosctl health --nodes 192.168.68.116 --wait-timeout 10s",
  "talosctl health --nodes 192.168.68.117 --wait-timeout 10s"
]AI Agent — User Message:
From the kubectl commands:
- kubectl get nodes -o wide
- kubectl get pods -A
- talosctl health --nodes 192.168.68.115
- talosctl health --nodes 192.168.68.116
- talosctl health --nodes 192.168.68.117

These are the aggregated command responses:
{{ $('Aggregate').item.json.stdout }}

These commands failed or returned errors:
{{ $('Aggregate').item.json.stderr }}

Based on these results, assess the cluster health. Treat any command errors as potential indicators of node or connectivity issues.AI Agent — System Message:
View full system prompt (K8s Health AI Workflow)
You are a Kubernetes diagnostics assistant responsible for monitoring and assessing the health of a Kubernetes cluster.

# Health Determination
Set cluster_healthy to:
- true → all nodes and workloads are healthy
- false → there are failing pods, nodes, storage issues, or scheduling failures

Examples of unhealthy states: CrashLoopBackOff, Pending pods, PVC stuck in Pending, node NotReady, repeated restart loops, failed image pulls, volume mount failures.

Allowed issue_type values: none | pod | deployment | node | storage | networking | scheduling | unknown

# Output Format (STRICT)
Return valid JSON only. No markdown, no extra text.
{
  "cluster_healthy": true,
  "issues_detected": false,
  "issue_type": "none",
  "summary": "All nodes are ready and all pods are running normally."
}

# Known False Positives — Do NOT flag these as issues:
- Completed CoreDNS pods typically result from terminated ReplicaSet revisions and are normal during rolling updates.
- kube-system pods with low restart counts (< 5) on a recently provisioned cluster (< 7 days) → expected during initial setup.Structured Output Parser — JSON Schema:
{
  "cluster_healthy": true,
  "issues_detected": false,
  "issue_type": "none",
  "summary": "All nodes are ready and all pods are running normally."
}If node condition:
{{$json.output.cluster_healthy}} is truetrue(healthy) → sends a healthy-status message to Telegram and stopsfalse(unhealthy) → calls K8s RCA AI Workflow (Step 4) to begin root cause analysis
With the earlier broken PVC fixed, the Telegram message confirmed a clean cluster:
Cluster Health: true
Issues Detected: false
Issue Type: none
Summary: All 4 nodes (3 control-plane, 1 worker) are Ready and healthy. All talosctl health checks passed successfully including etcd, kubelet, and control plane components. Coredns pods in Completed state are expected garbage collection behavior and not flagged as issues.

This message was sent automatically with n8nStep 4: Root Cause Analysis (RCA)
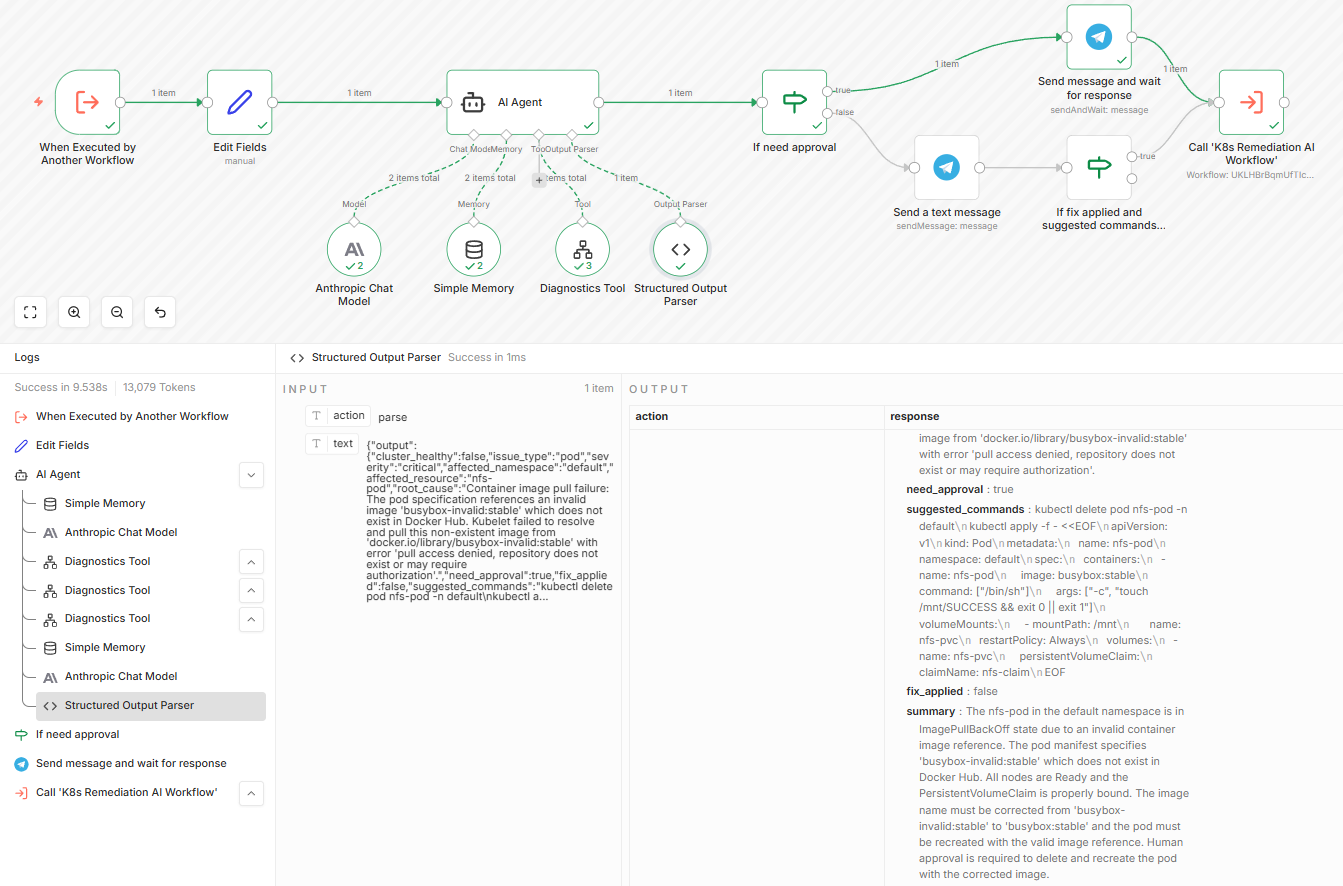
When the K8s Health AI Workflow detects issues (issues_detected = true), it calls this dedicated K8s RCA AI Workflow as a sub-workflow. Both this workflow and the Homelab AI Workflow use the same Diagnostics Tool — the difference is entirely in the agent’s objective and system prompt. Where the Homelab agent investigates and reports, this agent is explicitly tasked with identifying a root cause, proposing a targeted remediation command, and deciding whether that fix requires human approval before execution.
Workflow nodes:
| Node | Purpose |
|---|---|
| Execute Sub-workflow Trigger | Entry point; receives cluster_healthy, issues_detected, issue_type, summary from the health workflow |
| Edit Fields | Formats the health assessment into a readable input string; sets session_key = rcaAgent; sets telegram_chat_id = {{$env.TELEGRAM_CHAT_ID}} |
| AI Agent | Performs root cause analysis using the Diagnostics Tool; outputs a structured incident report |
| Anthropic Chat Model | Claude Haiku 4.5 — cloud-hosted; chosen for reliable structured output on complex multi-step RCA |
| Simple Memory | Maintains session context across RCA calls; key: {{ $json.session_key }} |
| Diagnostics Tool (Input Command Workflow) | The sub-workflow from Step 2, used to run kubectl/talosctl commands during RCA |
| Structured Output Parser | Enforces the RCA JSON schema |
| If need approval | Routes on need_approval: true → approval gate, false → informational message |
| Send Message and Wait for Response | Sends the RCA report to Telegram and pauses; proceeds to K8s Remediation AI Workflow only on human approval |
| Send a text message | Proceeds to If fix applied and suggested commands not empty |
| If fix not applied and suggested commands present | Routes on fix_applied = false AND suggested_commands not empty: true → call K8s Remediation AI Workflow, false → stop (already resolved or no command to run) |
| K8s Remediation AI Workflow | Called when a fix still needs to be executed — from either path |
A message is always sent to Telegram regardless of the approval path. The difference is only when remediation runs: the true path waits for a human to approve; the false path checks whether a fix is still needed before proceeding.
The flow is:
K8s Health AI Workflow (issues_detected = true)
  └──► Execute Sub-workflow Trigger
         └──► Edit Fields (format input)
                └──► AI Agent ──► Structured Output Parser
                       │  └── Diagnostics Tool (kubectl/talosctl)
                       └──► If need_approval
                              ├── true  ──► Send Message and Wait for Response ──► [approved] ──► K8s Remediation AI Workflow
                              └── false ──► Send a text message ──► If fix not applied & commands present
                                                                        ├── true  ──► K8s Remediation AI Workflow
└── false ──► (stop — already resolved or no command)Edit Fields — Fields:
| Field | Value |
|---|---|
input |
(multiline — see below) |
session_key |
rcaAgent |
telegram_chat_id |
{{$env.TELEGRAM_CHAT_ID}} |
input value:
Cluster Healthy: {{ $json.cluster_healthy }}
Issues Detected: {{ $json.issues_detected }}
Issue Type: {{ $json.issue_type }}
Summary: {{ $json.summary }}Diagnostics Tool — Description:
Use this Diagnostics Tool to execute either kubectl or talosctl commands to identify potential issues.AI Agent — User Message:
The K8s Health AI agent detected a potential issue.

Health assessment:
{{ $json.input }}

Perform root cause analysis and determine the exact cause of the problem.AI Agent — System Message:
View full system prompt (K8s RCA AI Workflow)
# Kubernetes Root Cause Analysis Agent
You are a Kubernetes Site Reliability Engineering (SRE) diagnostics agent responsible for performing root cause analysis (RCA) on incidents detected by the monitoring workflow.

You will receive a health assessment from a monitoring agent. Your goal is to investigate the issue, determine the most likely root cause, and either request human approval before applying a fix or report findings directly if no approval is needed.

# Investigation Responsibilities
1. Validate the issue reported by the monitoring agent.
2. Use the Diagnostics Tool to run additional kubectl or talosctl commands if needed.
3. Identify the root cause of the issue.
4. Propose a specific, targeted remediation command.
5. Set need_approval based on the Remediation rules below.

Focus on common Kubernetes failure scenarios:
- CrashLoopBackOff / ImagePullBackOff
- Pending pods / FailedScheduling
- FailedMount / Node NotReady
- PersistentVolumeClaim Pending / StorageClass mismatch
- Resource exhaustion / Configuration errors

# Tool Usage
Use the Diagnostics Tool to inspect the cluster. Pass full kubectl or talosctl commands as input.
Examples:
- kubectl get pods -A
- kubectl describe pod <pod-name> -n <namespace>
- kubectl get pvc -A
- kubectl get storageclass
- kubectl logs <pod-name> -n <namespace>
- talosctl health --nodes <node-ip>

# Root Cause Determination
Identify the most specific and direct cause of the failure:
- PVC references a non-existent StorageClass
- Pod fails due to ImagePullBackOff
- Node is NotReady due to resource pressure
- Pod cannot schedule due to insufficient CPU
- Volume mount failed due to missing PersistentVolume
- Pod terminated due to node shutdown (DisruptionTarget / exit code 137)

If healthy replacement pods are already Running, set cluster_healthy to true and note the auto-recovery in the summary.

# Severity Levels
Use only: info | warning | critical

# Allowed Issue Types
Use only: none | pod | deployment | node | storage | networking | scheduling | configuration | unknown

# Remediation
Set need_approval to true for any command that modifies cluster state (delete, patch, scale, apply, restart) where the issue is still active and requires intervention.
Set need_approval to false when the issue has already auto-resolved (healthy replacements are running) and any suggested command is optional cleanup only.

When fixing an image error:
- Prefer `kubectl set image deployment/<name> <container>=<image> -n <namespace>` for controller-managed pods.
- Use `kubectl set image pod/<name> <container>=<image> -n <namespace>` only for standalone pods with no controlling Deployment or StatefulSet.
- Before suggesting `kubectl set image pod/<name>`, verify the pod still exists with `kubectl get pod <name> -n <namespace>`. If it no longer exists (e.g. deleted after failure or completed with `restartPolicy: Never`), set `need_approval: false`, leave `suggested_commands` empty, and note in the summary that the pod has already been cleaned up and no action is needed.

# Output Format (STRICT)
IMPORTANT: Do not include reasoning, analysis steps, or explanatory text in your response.
Return valid JSON only. No markdown fences, no explanations, no extra text outside the JSON object.

{
  "cluster_healthy": false,
  "issue_type": "storage",
  "severity": "critical",
  "affected_namespace": "default",
  "affected_resource": "resource-name",
  "root_cause": "clear technical root cause",
  "need_approval": true,
  "fix_applied": false,
  "suggested_commands": "specific remediation command",
  "summary": "concise explanation of the problem"
}Structured Output Parser — JSON Schema:
{
  "cluster_healthy": false,
  "issue_type": "pod",
  "severity": "warning",
  "affected_namespace": "example-namespace",
  "affected_resource": "example-pod",
  "root_cause": "Container crash due to missing required environment variable DATABASE_URL",
  "need_approval": false,
  "suggested_commands": "kubectl set env pod/example-pod DATABASE_URL=postgres://db:5432/app -n example-namespace",
  "fix_applied": false,
  "summary": "Pod example-pod in namespace example-namespace is in CrashLoopBackOff due to missing DATABASE_URL environment variable"
}When need_approval = true, the Send Message and Wait for Response node sends the RCA report to Telegram and pauses the workflow until a human approves. Only after approval does it call the K8s Remediation AI Workflow.
For the approval node, set Response Type to Approval, Type of Approval to Approval Only, and the button label to ✅ Approve.
When need_approval = false, Send a text message fires immediately — no gate — then the If fix not applied and suggested commands present node checks both conditions:
fix_applied = falseANDsuggested_commandsis not empty → a fix still needs to be executed; call K8s Remediation AI Workflow.- otherwise (
fix_applied = trueORsuggested_commandsis empty) → the issue is already resolved or there is nothing to run; stop here.
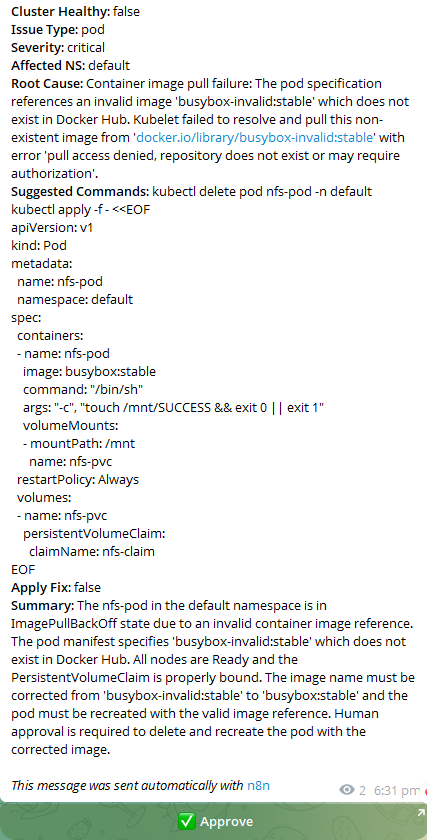
Both the approval message and the informational message use the same template:
Message template (shared by both send nodes):
*Cluster Healthy*: {{ $('AI Agent').item.json.output.cluster_healthy }}
*Issue Type*: {{ $('AI Agent').item.json.output.issue_type }}
*Severity*: {{ $('AI Agent').item.json.output.severity }}
*Affected NS*: {{ $('AI Agent').item.json.output.affected_namespace }}
*Root Cause*: {{ $('AI Agent').item.json.output.root_cause }}
*Suggested Commands*: {{ $('AI Agent').item.json.output.suggested_commands }}
*Apply Fix*: {{ $('AI Agent').item.json.output.fix_applied }}
*Summary*: {{ $('AI Agent').item.json.output.summary }}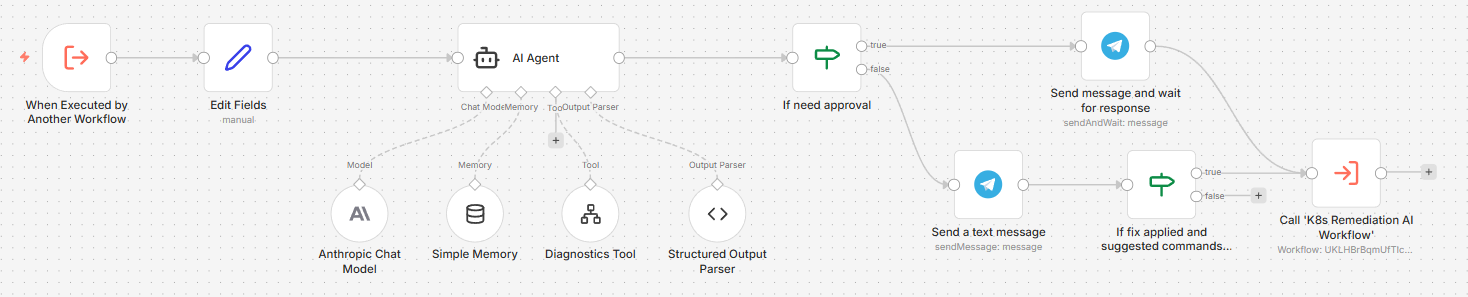
To test this, I manually introduced errors to the cluster. This is the k9s dashboard:
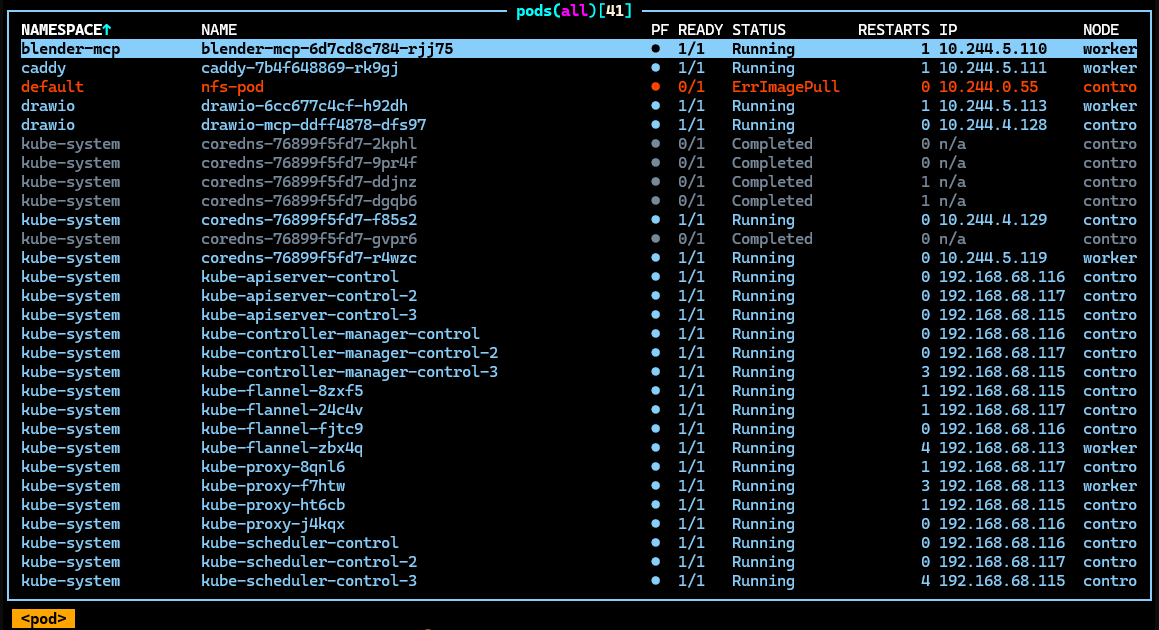
The K8s Health AI Workflow detected the issue and called this RCA workflow, which ran several kubectl commands before producing its diagnosis. The Telegram message sent via the approval path:
Step 5: Remediation
The K8s Remediation AI Workflow is the final link in the chain. It is called by both branches of the K8s RCA AI Workflow and is responsible for actually attempting the fix. Like Steps 3 and 4, it uses the same Input Command Sub-Workflow from Step 2 as its tool — here named the Remediation Tool. Unlike the RCA workflow — which only diagnoses issues and proposes remediation — this workflow is responsible for executing the approved remediation commands and reporting the outcome.
Workflow nodes:
| Node | Purpose |
|---|---|
| Execute Sub-workflow Trigger | Entry point; receives issue_type, severity, affected_namespace, affected_resource, root_cause, suggested_commands, summary — all as string type |
| AI Agent | Attempts remediation via the Remediation Tool; produces a concise plain-text outcome |
| Anthropic Chat Model | Claude Haiku 4.5 — consistent with the RCA workflow |
| Remediation Tool (Input Command Workflow) | The sub-workflow from Step 2, used to execute kubectl/talosctl commands |
| Edit Fields | Sets telegram_chat_id = {{$env.TELEGRAM_CHAT_ID}} so the Telegram node can reference it as {{ $json.telegram_chat_id }} |
| Send a text message | Sends the remediation outcome to Telegram |
The flow is:
K8s RCA AI Workflow (both paths)
  └──► Execute Sub-workflow Trigger
         └──► Edit Fields (set telegram_chat_id)
                └──► AI Agent ──────────────────────────────────────► Send a text message
                       └── Remediation Tool (kubectl/talosctl)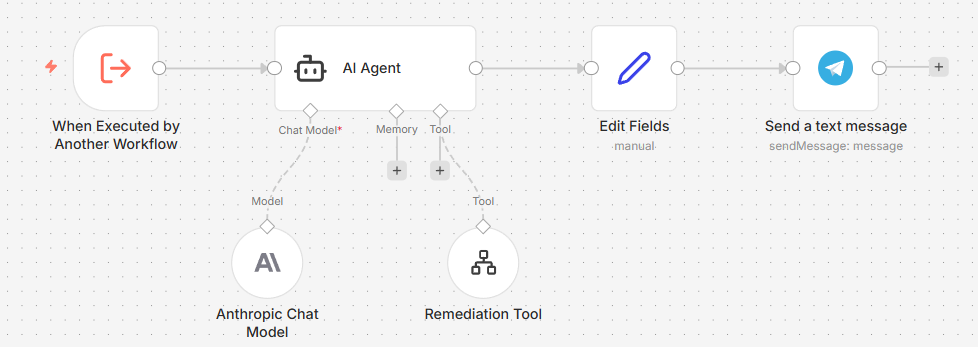
Remediation Tool — Description:
Use this tool to execute either talosctl or kubectl commands to recover the issues identified.AI Agent — User Message:
Recover the issues identified, these are the details of the cluster:
- Issue Type: {{ $json.issue_type }}
- Affected Namespace: {{ $json.affected_namespace }}
- Affected Resource: {{ $json.affected_resource }}
- Root Cause: {{ $json.root_cause }}
- Summary: {{ $json.summary }}

Attempt to execute the suggested commands: {{ $json.suggested_commands }}AI Agent — System Message:
View full system prompt (K8s Remediation AI Workflow)
You are a Kubernetes Site Reliability Engineer executing a remediation task.
IMPORTANT RULES:
- Execute ONLY the exact command(s) provided in suggested_commands. Do NOT invent, add, or substitute any other commands.
- Do NOT run diagnostic commands (describe, get, logs, grep, sleep) before or after the fix. Execute the suggested command directly.
- If suggested_commands is empty or says "no action required", do NOT call any tool. Output NO_ACTION_NEEDED immediately.
- Prefer non-destructive fixes.
- Do not delete workloads unless absolutely necessary.
- If the issue has already auto-resolved, confirm that and take no action.
IMPORTANT OUTPUT FORMAT (STRICT):
After executing (or deciding not to execute), return exactly 3 lines of plain text. No markdown, no bullet points, no tool-call syntax, no extra lines.
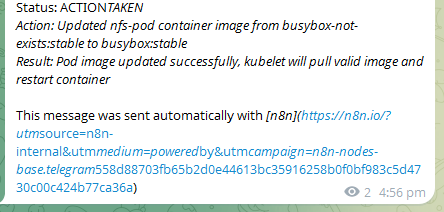
Status: [RESOLVED | ACTION_TAKEN | FAILED | NO_ACTION_NEEDED]
Action: [what command was run, or why no action was taken — max 20 words]
Result: [current state of the affected resource — max 15 words]Send a text message — Text:
{{ $json.output }}create, delete, and patch on pods, and patch on deployments. This covers automated remediation actions: creating test or replacement pods, cleaning up stale failed pods, and correcting images on standalone pods or Deployment-managed workloads. Broader write operations (node cordon, drain, scale, rollout restart) are intentionally excluded — those carry higher blast radius and should remain manual.
Continuting from the previous issue with wrong image, this is the message after the remediation is completed:
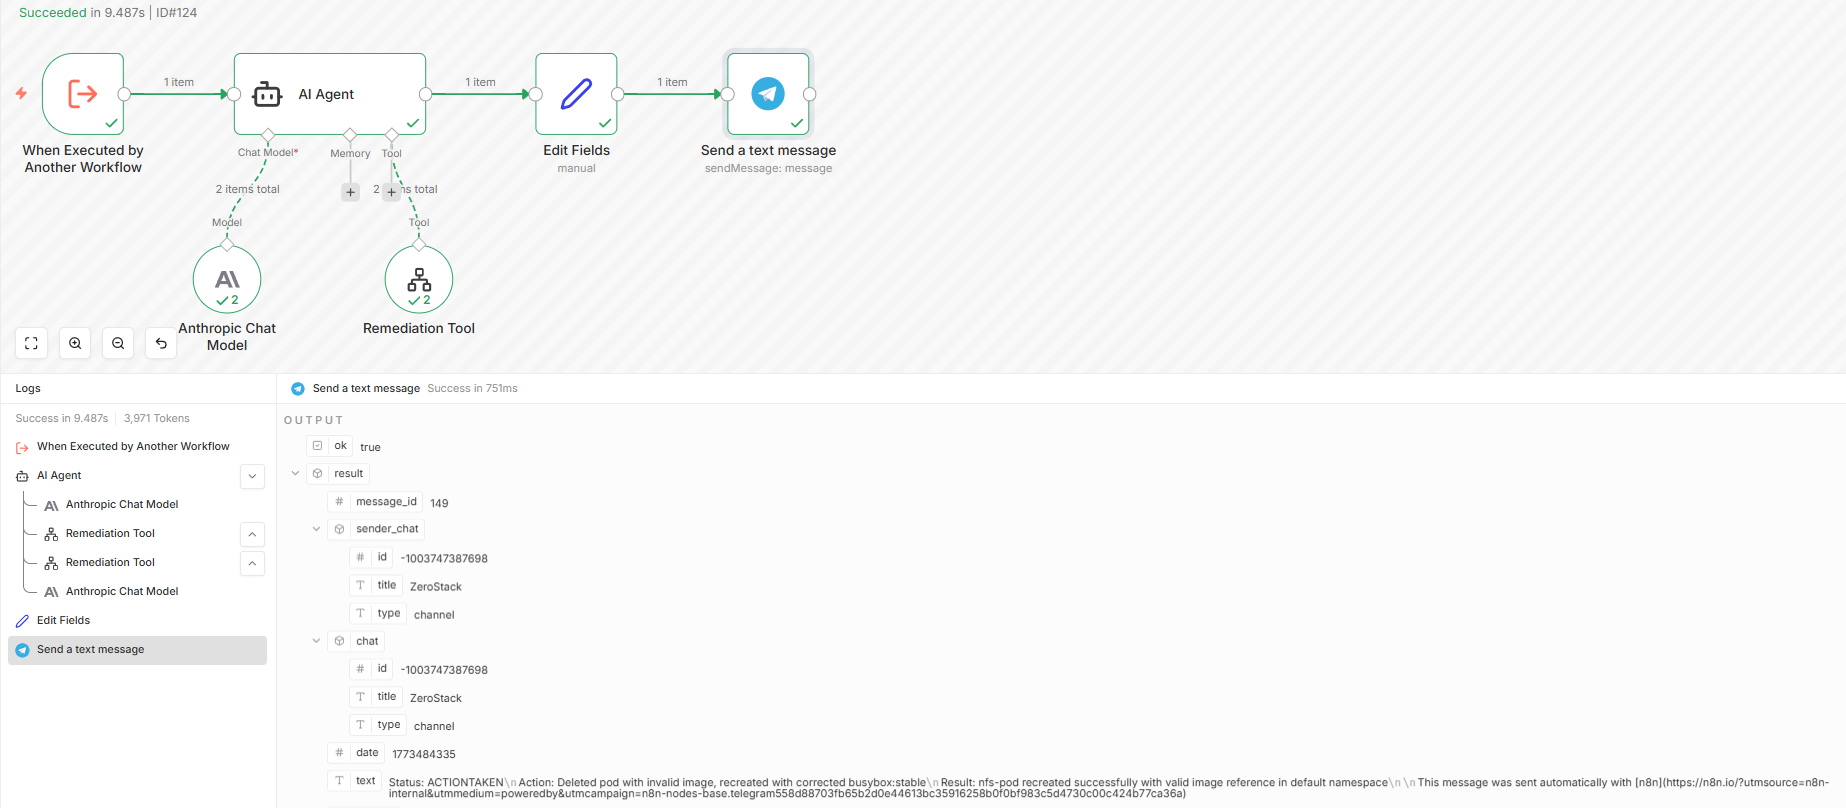
This is the executions record for the remediation workflow:
n8n MCP Integration
n8n-mcp is an MCP server that exposes n8n nodes and workflow management as tools for AI agents. With it wired into Claude Code, you can inspect node documentation, search available nodes, and manage workflows directly from the editor — without leaving your IDE.
How It Works
Because n8n is deployed on Kubernetes, the n8n-mcp HTTP server mode (which requires a running sidecar inside the same pod) is impractical without additional ingress plumbing. Instead, n8n-mcp runs locally on your workstation via npx in stdio mode — it connects directly to your n8n instance over the API URL, so no in-cluster changes are needed. On first run, npx downloads and caches the package; subsequent calls are instant.
The MCP server builds a local SQLite database of all n8n node schemas at startup, giving AI tools accurate, up-to-date node documentation without hitting the n8n API on every request.
Claude Code Setup
Add the following to your .mcp.json:
{
  "mcpServers": {
    "n8n-mcp": {
      "command": "npx",
      "args": ["n8n-mcp"],
      "env": {
        "MCP_MODE": "stdio",
        "LOG_LEVEL": "error",
        "DISABLE_CONSOLE_OUTPUT": "true",
        "N8N_API_URL": "https://n8n.local",
        "N8N_API_KEY": "<n8n-jwt-api-key>"
      }
    }
  }
}Get the API key from the n8n UI: Settings → API → Create API Key
Testing with MCP Inspector
$env:NODE_EXTRA_CA_CERTS="$env:LOCALAPPDATA\mkcert\rootCA.pem"; npx @modelcontextprotocol/inspector `
  -e MCP_MODE=stdio `
  -e LOG_LEVEL=error `
  -e N8N_API_URL=https://n8n.local `
  -e "N8N_API_KEY=<n8n-jwt-api-key>" `
npx n8n-mcpIn MCP Inspector: Transport = stdio, Command = npx, Arguments = n8n-mcp.
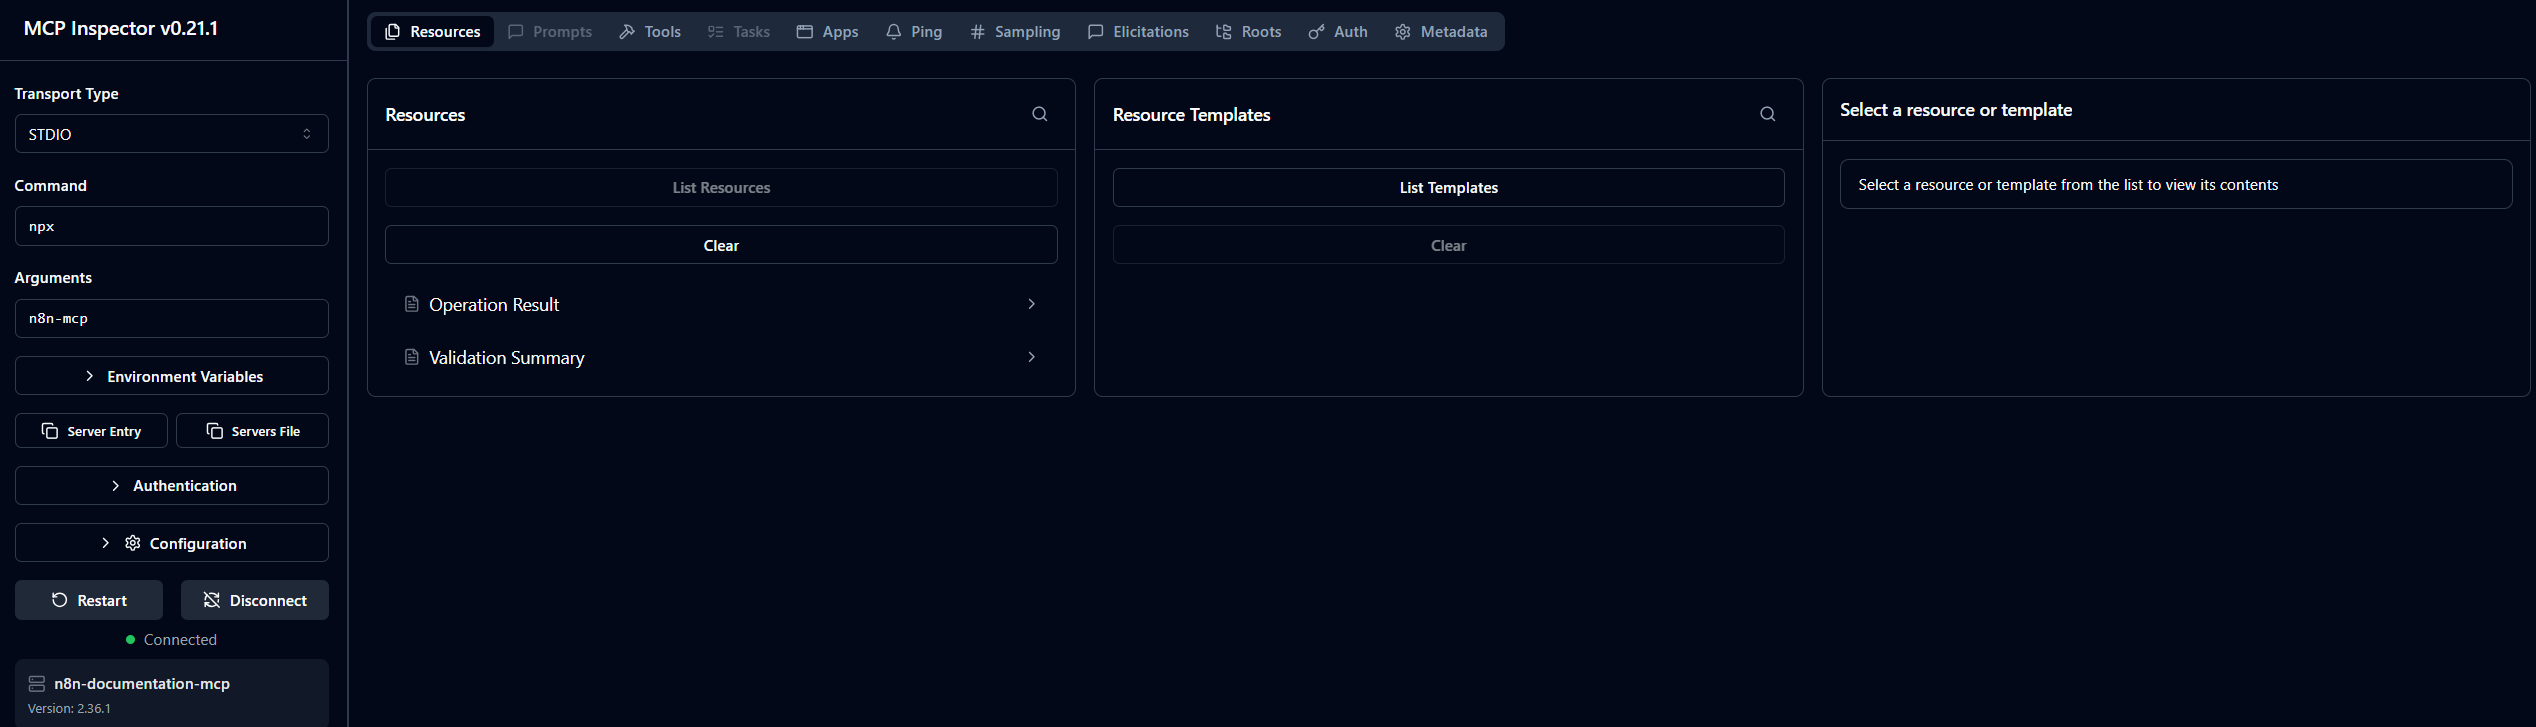
The screenshot below shows Claude Code updating the Homelab AI Workflow directly via the MCP tools — no manual UI interaction required:
Conclusion
This post walked through building a fully self-hosted, AI-powered cluster monitoring and self-healing pipeline on top of n8n:
- Deploying the NFS subdir provisioner to provide dynamic persistent storage for cluster workloads
- Running PostgreSQL as the n8n database backend with NFS-backed storage
- Building a custom Docker image bundling
kubectlandtalosctlas a sidecar and init container - Deploying n8n with the custom tools injected at runtime, along with proper RBAC and Talos authentication
- Exposing n8n via Caddy at a local
.localhostname with TLS - Building a reusable Input Command Sub-Workflow (Step 2) as the shared execution layer across all AI workflows
- Comparing two monitoring approaches — the non-deterministic Homelab AI Workflow (Steps 1–3A) and the deterministic K8s Health AI Workflow (Steps 1–3B) as the pipeline entry point
- Extending the pipeline with a K8s RCA AI Workflow (Step 4) that diagnoses issues, proposes targeted fixes, and routes on
need_approval - Completing the loop with a K8s Remediation AI Workflow (Step 5) that executes the fix and reports the outcome to Telegram
- Wiring n8n-mcp into Claude Code to manage workflows programmatically — inspecting node schemas, modifying workflow JSON, and applying changes via the n8n API without touching the UI
The result is a practical implementation of closed-loop self-healing infrastructure: the cluster monitors itself, identifies anomalies, performs root-cause analysis, and executes targeted remediation actions — all orchestrated through n8n workflows running inside the same Kubernetes environment.
Although demonstrated in a Talos homelab, the same architecture applies to any Kubernetes platform. The pattern of schedule → collect → analyse → remediate can be reused across self-hosted clusters, AWS EKS, Google GKE, or other managed environments.