JMC: Java Performance Profiling Simplified
In this blog post, I explore the capabilities of JDK Mission Control, a powerful tool for low-overhead performance analysis and diagnostics of Java applications.
If you’ve read my previous post, you’ll know that I have been using DeepSeek extensively. However, with the increasing popularity of DeepSeek, I have noticed a degradation in service performance, as reflected in the DeepSeek status. To mitigate this, I have switched to Perplexity Pro a complimentary service offered to Singtel customers. For those without access to this, an alternative is Google AI Studio. Having an AI pair programmer significantly enhances the troubleshooting process.
Setting up JMC
To begin, download and install JMC from the official JMC 9.0.0 downloads page.
As part of my ongoing work, I aimed to optimize the inference performance of Micronaut-Llama3 to support Unsloth’s DeepSeek-R1. Since DeepSeek-R1 only supports Q4 and Q8 quantization for the Llama architecture, I opted for the Q8_0 model.
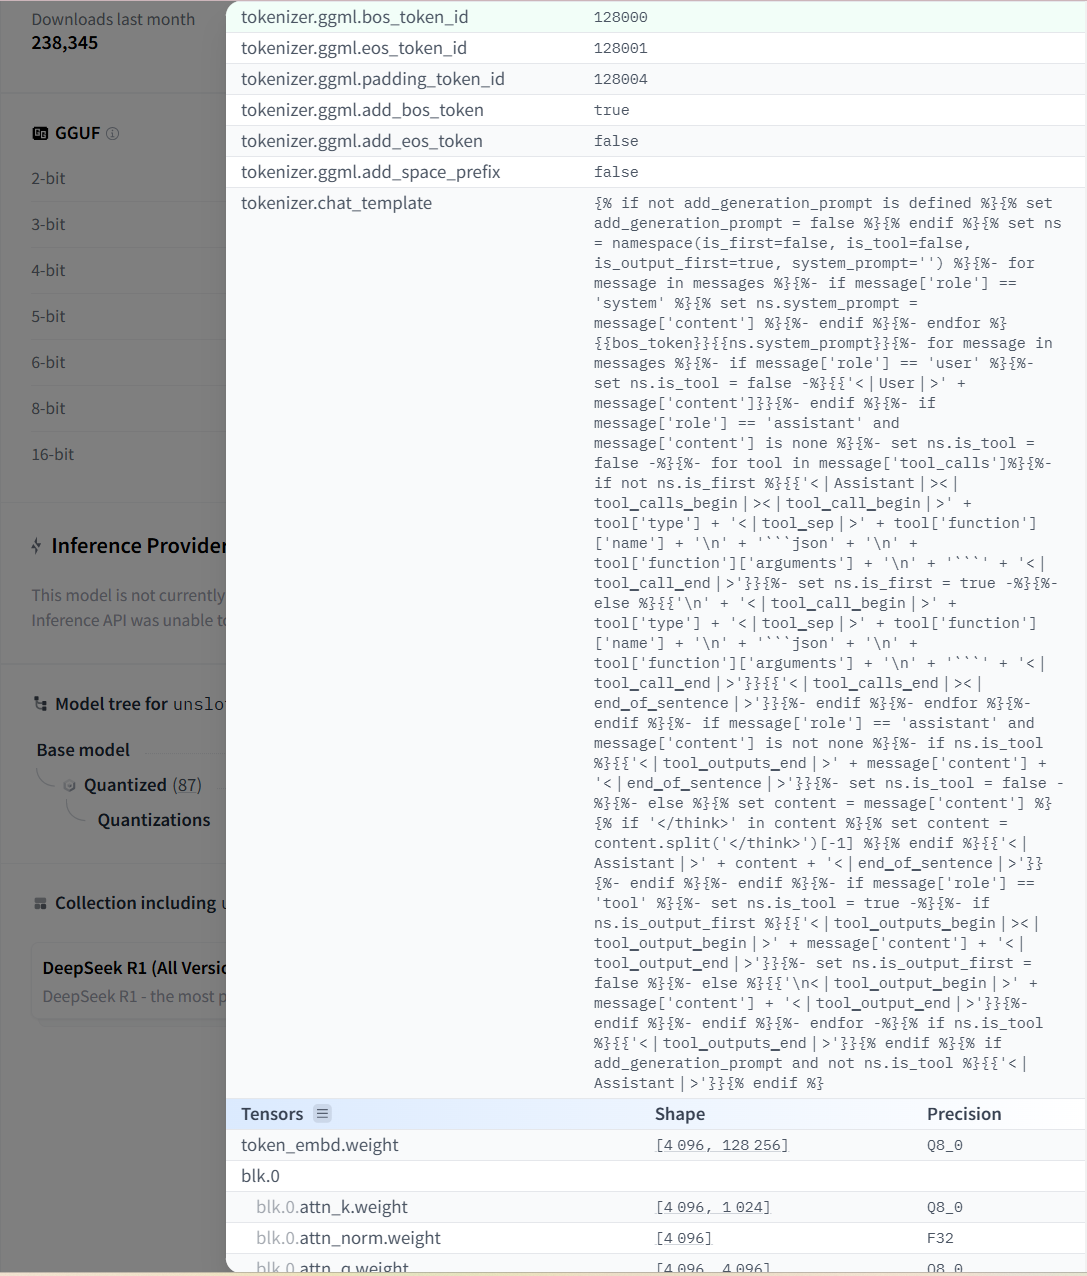
To integrate support for this model, I made the following modifications:
Changes to micronaut/model/ChatFormat.java:
public ChatFormat(Tokenizer tokenizer) {
    this.tokenizer = tokenizer;
    Map<String, Integer> specialTokens = this.tokenizer.getSpecialTokens();
    specialTokens.putIfAbsent("<|begin_of_text|>", 128000); // for DeepSeek-R1
    specialTokens.putIfAbsent("<|end_of_text|>", 128001); // for DeepSeek-R1

    this.beginOfText = getRequiredToken(specialTokens, "<|begin_of_text|>");
    this.startHeader = getRequiredToken(specialTokens, "<|start_header_id|>");
    this.endHeader = getRequiredToken(specialTokens, "<|end_header_id|>");
    this.endOfTurn = getRequiredToken(specialTokens, "<|eot_id|>");
    this.endOfText = getRequiredToken(specialTokens, "<|end_of_text|>");
    this.endOfMessage = specialTokens.getOrDefault("<|eom_id|>", -1); // only in 3.1
    this.stopTokens = Set.of(endOfText, endOfTurn);
}
Changes to micronaut/model/Tokenizer.java:
public Tokenizer(Vocabulary vocabulary, List<Pair<Integer, Integer>> merges, String regexPattern,
        Map<String, Integer> specialTokens) {
    specialTokens.putIfAbsent("<|begin_of_text|>", 128000); // for DeepSeek-R1
    specialTokens.putIfAbsent("<|end_of_text|>", 128001); // for DeepSeek-R1

    this.vocabulary = vocabulary;
    this.compiledPattern = regexPattern != null ? Pattern.compile(regexPattern) : null;
    this.specialTokens = new HashMap<>(specialTokens);
    this.merges = new HashMap<>();
    for (Pair<Integer, Integer> pair : merges) {
        int firstIndex = pair.first();
        int secondIndex = pair.second();
        int mergeIndex = vocabulary.getIndex(vocabulary.get(firstIndex) + vocabulary.get(secondIndex))
                .orElseThrow();
        this.merges.put(pair, mergeIndex);
    }
}
...
public String decode(List<Integer> tokens) {
    String decoded = decodeImpl(tokens);

    // Replace the original decodedBytesAsInts with the below
    int[] decodedBytesAsInts = decoded.codePoints()
            .map(cp -> {
                Integer decodedByte = BYTE_DECODER.get(cp);
                if (decodedByte == null) {
                    return (int) '?';
                }
                return decodedByte;
            })
            .toArray();

    byte[] rawBytes = new byte[decodedBytesAsInts.length];
    for (int i = 0; i < decoded.length(); i++) {
        rawBytes[i] = (byte) decodedBytesAsInts[i];
    }
    return new String(rawBytes, StandardCharsets.UTF_8);
}
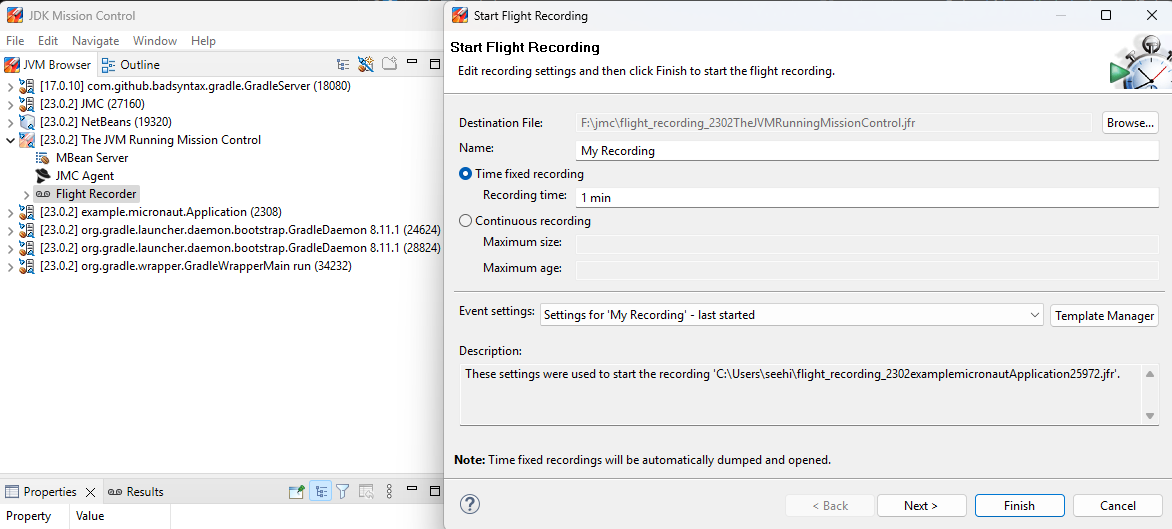
Profiling with JMC
To start profiling, simply initiate the Flight Recorder, as shown below:
Referencing the Llama3.java post, I ran the application using:
gradlew run
Configuration in application.properties:
micronaut.application.name=llama3
micronaut.server.port=8888
llama.BatchSize=32
llama.VectorBitSize=512
llama.PreloadGGUF=DeepSeek-R1-Distill-Llama-8B-Q8_0.gguf
options.model_path=DeepSeek-R1-Distill-Llama-8B-Q8_0.gguf
options.temperature=0.1f
options.topp=0.95f
options.seed=42
options.max_tokens=512
options.stream=true
options.echo=true
options.fullResponseStream=true
Test URL:
http://localhost:8888/api/llama3/generate?prompt=Why%20is%20the%20sky%20blue?
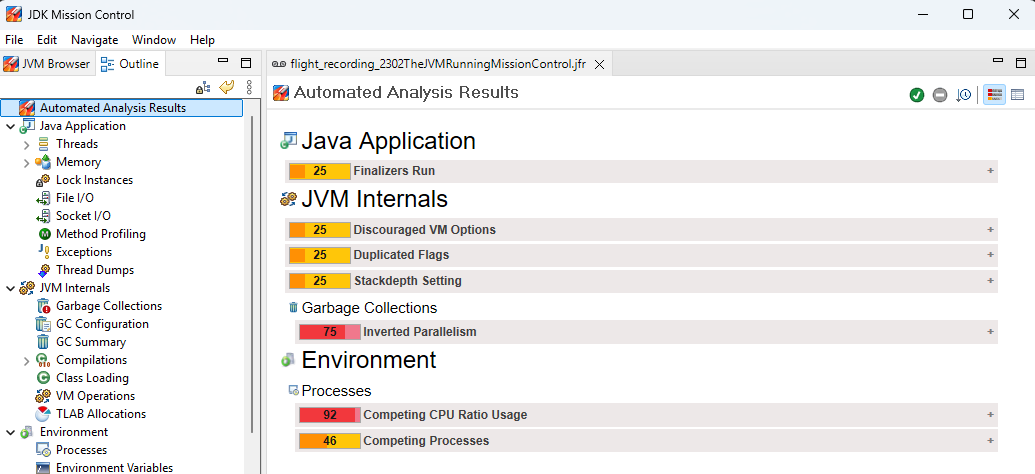
The profiling results are as follows:
Performance Optimization: ByteVector Operations
The flame graph analysis highlighted ByteVector operations as an optimization opportunity:
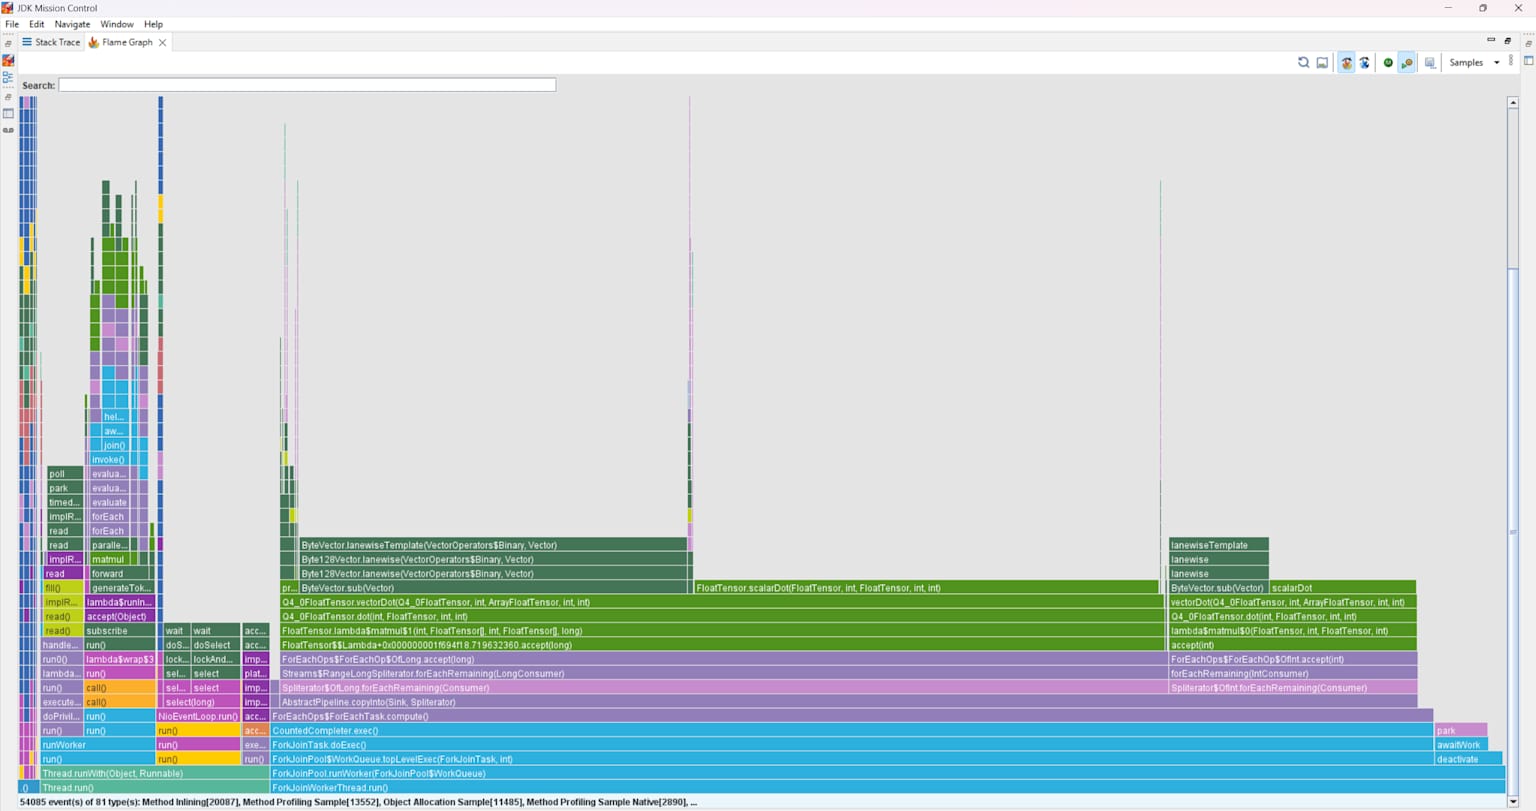
Optimized code snippet:
// Instead of separate operations
ByteVector loBytes = wBytes.and(MASK_LOW).sub(OFFSET_8);
ByteVector hiBytes = wBytes.lanewise(VectorOperators.LSHR, 4).sub(OFFSET_8);

// Combine operations
ByteVector loBytes = wBytes.and(MASK_LOW);
ByteVector hiBytes = wBytes.lanewise(VectorOperators.LSHR, 4).and(MASK_LOW);
ByteVector combined = loBytes.blend(hiBytes.lanewise(VectorOperators.LSHL, 4), BLEND_MASK);
JMC vs. VisualVM: A Comparative Analysis
JMC offers a more sophisticated and efficient profiling experience, making it a preferred tool for optimizing Java applications at scale.
| Feature | VisualVM | JDK Mission Control (JMC) |
|---|---|---|
| Ease of Use | Simple, user-friendly | Advanced, steeper learning curve |
| Performance Overhead | Higher | Lower |
| Flame Graphs | Requires plugins | Built-in |
| Data Granularity | Basic monitoring data | Detailed, in-depth insights |
| Best Use Case | General debugging & profiling | Low-overhead, enterprise-grade profiling |
| Data Collection Method | JMX | Java Flight Recorder (JFR) |
By leveraging JMC, I was able to identify and optimize key performance bottlenecks in my project. If you’re working with Java applications that require in-depth profiling, JMC is a must-have tool.
Stay tuned for more insights on optimizing Java applications!