Log Management with Graylog
In this blog post, I’ll guide you through the setup of Graylog, an open-source log management platform, within a HomeLab environment, providing a comprehensive solution for log analysis and monitoring.
Setting up Graylog with Docker
To initiate our exploration of Graylog, we’ll opt for a Docker Installation, which ensures simplicity and ease of deployment. Follow the steps outlined in the official documentation to set up Graylog via Docker. Upon successful installation, access the Graylog interface by navigating to http://localhost:9000/, and use the default credentials: admin/admin.

Configure MongoDB
MongoDB serves as the backend database for Graylog, facilitating efficient data storage and retrieval. Below is the configuration snippet for deploying MongoDB within our Kubernetes environment:
apiVersion: apps/v1
kind: Deployment
metadata:
  name: mongo
  namespace: log
spec:
  replicas: 1
  selector:
    matchLabels:
      app: mongo
  template:
    metadata:
      labels:
        app: mongo
    spec:
      containers:
      - name: mongo
        image: mongo:6.0.14
        ports:
        - containerPort: 27017
---
apiVersion: v1
kind: Service
metadata:
  labels:
    app: mongo
  name: mongo-svc
  namespace: log
spec:
  ports:
  - port: 27017
    protocol: TCP
    targetPort: 27017
  selector:
    app: mongo
Configure Opensearch
OpenSearch, a robust and scalable open-source search and analytics engine, complements Graylog by providing enhanced capabilities for data indexing and querying. Utilize the following configuration to deploy OpenSearch:
apiVersion: apps/v1
kind: Deployment
metadata:
  name: opensearch
  namespace: log
spec:
  replicas: 1
  selector:
    matchLabels:
      app: opensearch
  template:
    metadata:
      labels:
        app: opensearch
    spec:
      containers:
      - name: opensearch
        image: opensearchproject/opensearch:2.2.0
        env:
        - name: OPENSEARCH_JAVA_OPTS
          value: -Xms512m -Xmx512m
        - name: bootstrap.memory_lock
          value: "true"
        - name: discovery.type
          value: single-node
        - name: action.auto_create_index
          value: "false"
        - name: plugins.security.ssl.http.enabled
          value: "false"
        - name: plugins.security.disabled
          value: "true"
        # Can generate a password for `OPENSEARCH_INITIAL_ADMIN_PASSWORD` using a linux device via:
        # tr -dc A-Z-a-z-0-9_@#%^-_=+ < /dev/urandom  | head -c${1:-32}
        - name: OPENSEARCH_INITIAL_ADMIN_PASSWORD
          value: w6zp+GhiM2jvyT8MW#ANfI+Pz-IMppSs
        ports:
          - containerPort: 9200
---
apiVersion: v1
kind: Service
metadata:
  name: opensearch-svc
  namespace: log
spec:
  selector:
    app: opensearch
  type: NodePort
  ports:
  - name: "9200"
    port: 9200
    targetPort: 9200
    nodePort: 30200
Configure Graylog
The pivotal step involves configuring Graylog itself. Below, you’ll find the deployment configuration for Graylog, including necessary environment variables for seamless integration with MongoDB and OpenSearch:
apiVersion: apps/v1
kind: Deployment
metadata:
  name: graylog
  namespace: log
spec:
  replicas: 1
  selector:
    matchLabels:
      app: graylog
  template:
    metadata:
      labels:
        app: graylog
    spec:
      containers:
      - name: graylog
        image: graylog/graylog:5.2
        env:
        - name: GRAYLOG_SERVER_JAVA_OPTS
          value: "-Xms1g -Xmx1g -server -XX:+UseG1GC -XX:-OmitStackTraceInFastThrow"
        - name: GRAYLOG_NODE_ID_FILE
          value: /usr/share/graylog/data/data/node-id
        - name: GRAYLOG_PASSWORD_SECRET
          value: e2ssyyBDYfKMmBm7iAcQ3WjroGlcueh8mzC7nL6suirLw2lsSHTEQeVuDf1rJ7WTZaWA3GeDeqwW6tMwbnSd4lkBHgCSUzEp
        # echo -n "Enter Password: " && head -1 </dev/stdin | tr -d '\n' | sha256sum | cut -d" " -f1
        - name: GRAYLOG_ROOT_PASSWORD_SHA2
          value: 8c6976e5b5410415bde908bd4dee15dfb167a9c873fc4bb8a81f6f2ab448a918
        - name: GRAYLOG_HTTP_BIND_ADDRESS
          value: 0.0.0.0:9000
        - name: GRAYLOG_HTTP_EXTERNAL_URI
          value: http://192.168.68.239:9000/
        - name: GRAYLOG_MONGODB_URI
          value: mongodb://mongo-svc.log.svc:27017/graylog
        - name: GRAYLOG_ELASTICSEARCH_HOSTS
          value: http://admin:admin@opensearch-svc.log.svc:9200
        ports:
        - containerPort: 9000
        - containerPort: 12201
---
apiVersion: v1
kind: Service
metadata:
  name: graylog-svc
  namespace: log
spec:
  type: LoadBalancer
  selector:
    app: graylog
  ports:
  - name: "9000"
    port: 9000
    targetPort: 9000
  - name: "12201"
    port: 12201
    targetPort: 12201
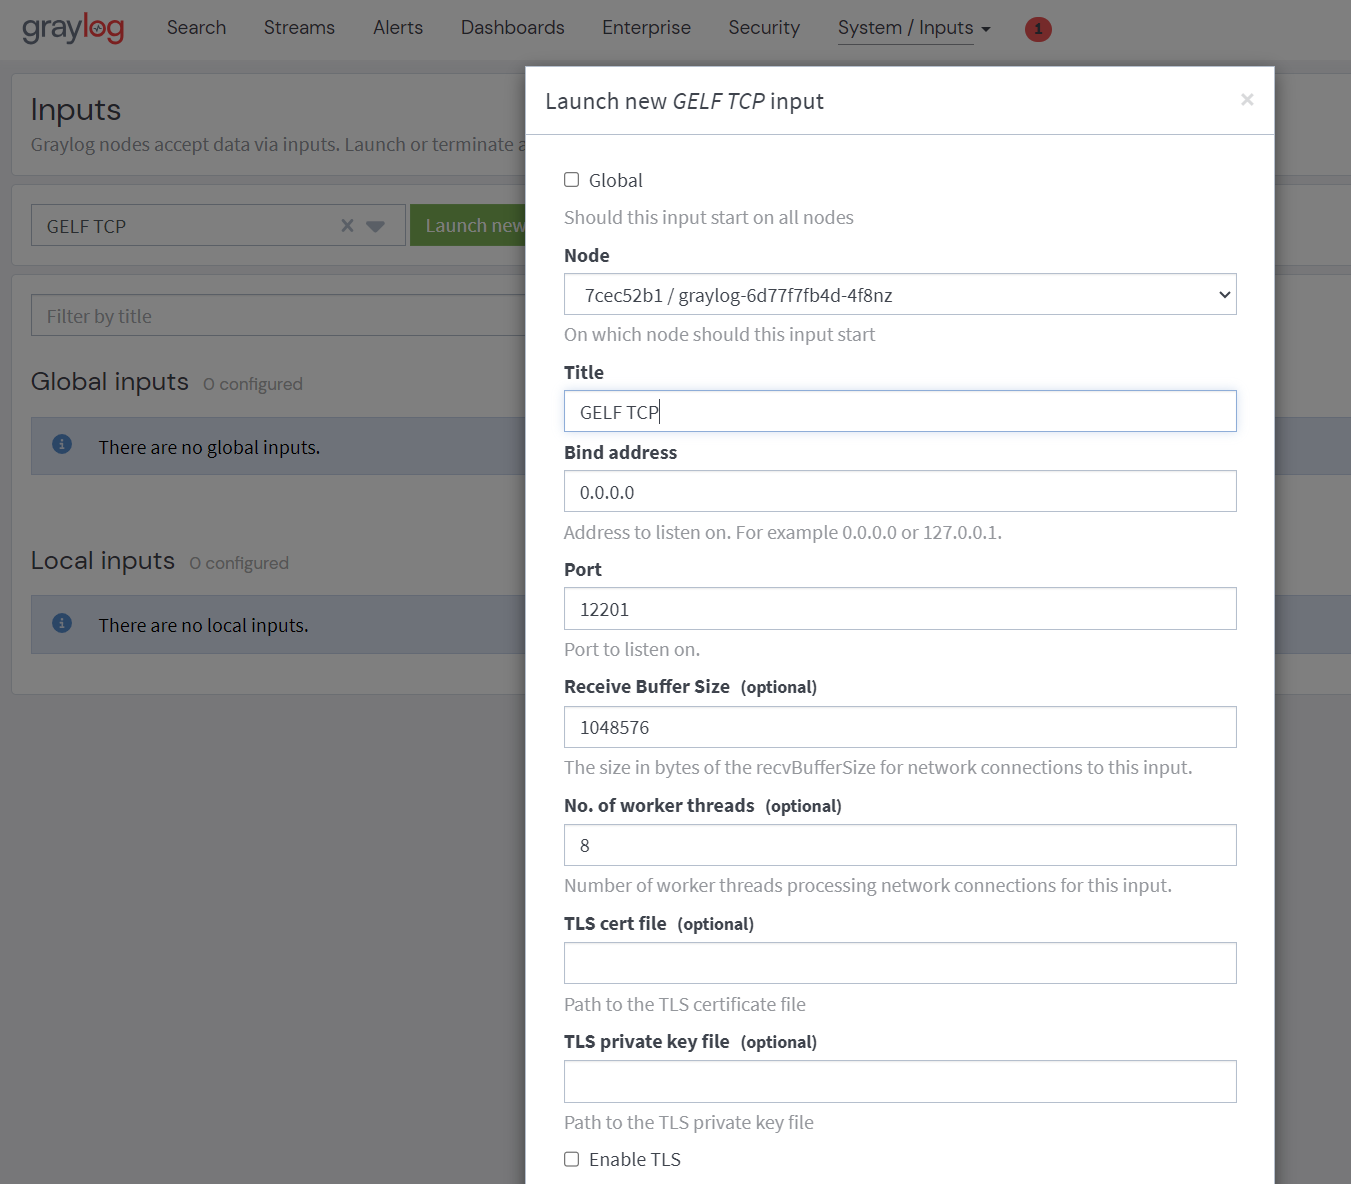
Once deployed, Graylog will be accessible via a LoadBalancer service, allowing for efficient log management and analysis. This is my GELF TCP input setup:
Deploying Fluent Bit for Log Forwarding
Fluent Bit emerges as a lightweight and high-performance log processor and forwarder, enhancing the overall log management infrastructure. Follow the steps below to integrate Fluent Bit into your HomeLab environment:
helm repo add fluent https://fluent.github.io/helm-charts
helm upgrade --install fluent-bit fluent/fluent-bit
Upon successful deployment, configure Fluent Bit to forward Kubernetes logs to Graylog using custom parsers and filters, ensuring seamless integration and enhanced log enrichment.
Customizing Log Parsing and Enrichment
Referencing from the JSON parser, this is my config:
[PARSER]
    Name        docker
    Format      json
    Time_Key    time
    Time_Format %Y-%m-%dT%H:%M:%S.%L
    Time_Keep   On
Setup fluent-bit.conf
Utilizing the tail input plugin, Fluent Bit channels all container logs to Graylog. The record modifier filter plugin is employed to append the essential key, Host, for GELF compatibility. The Fluent Bit Kubernetes Filter enhances log files with Kubernetes metadata. Lastly, the GELF output plugin facilitates the direct transmission of logs in GELF format to my Graylog TCP input. Below is the configuration excerpt from my fluent-bit.conf file:
[SERVICE]
    Daemon          Off
    Flush           1
    Log_Level       info
    Parsers_File    /fluent-bit/etc/parsers.conf
    Parsers_File    /fluent-bit/etc/conf/custom_parsers.conf
    HTTP_Server     On
    HTTP_Listen     0.0.0.0
    HTTP_Port       2020
    Health_Check    On

[INPUT]
    Name                tail
    Tag                 kube.*
    Path                /var/log/containers/*.log
    multiline.parser    docker, cri

[FILTER]
    Name    record_modifier
    Match   *
    Record  host k3s

[FILTER]
    Name            kubernetes
    Match           kube.*
    Kube_URL        https://kubernetes.default.svc:443
    Kube_CA_File    /var/run/secrets/kubernetes.io/serviceaccount/ca.crt
    Kube_Token_File /var/run/secrets/kubernetes.io/serviceaccount/token
    Kube_Tag_Prefix kube.var.log.containers.
    Merge_Log       On
    Merge_Log_Key   log_processed

[OUTPUT]
    Name                    gelf
    Match                   *
    Host                    192.168.68.239
    Port                    12201
    Mode                    tcp
    Gelf_Short_Message_Key  log
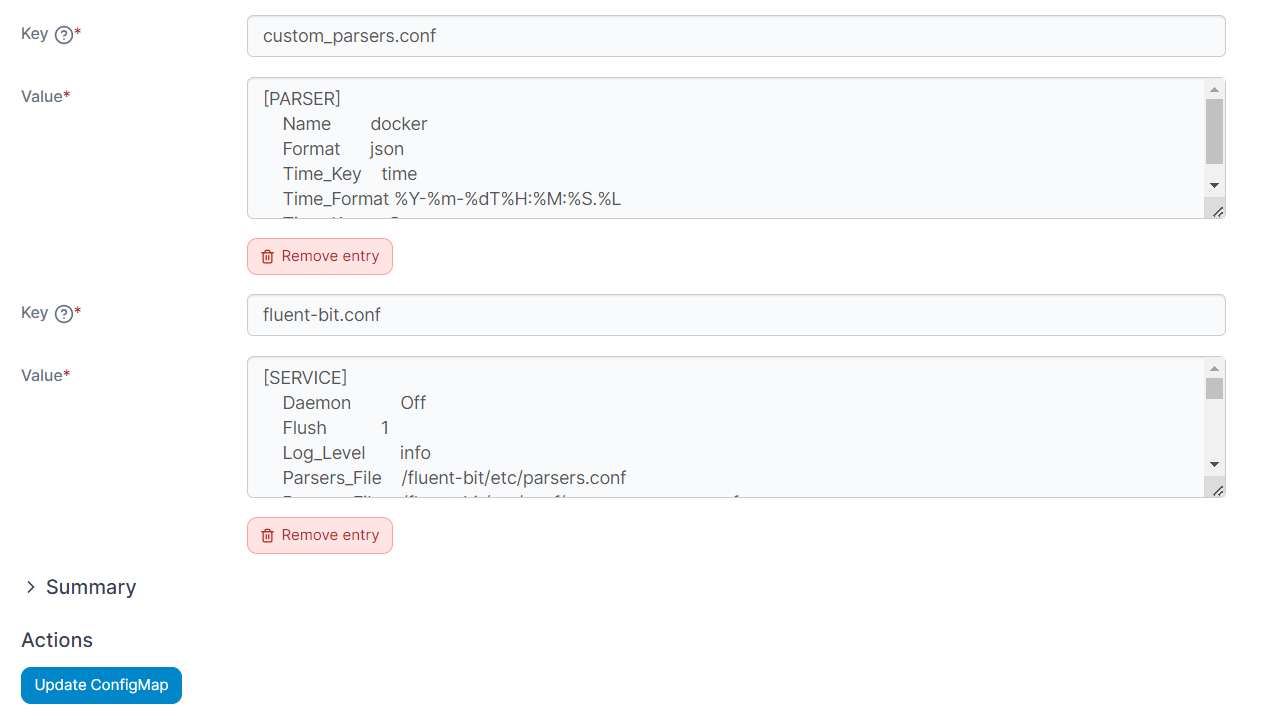
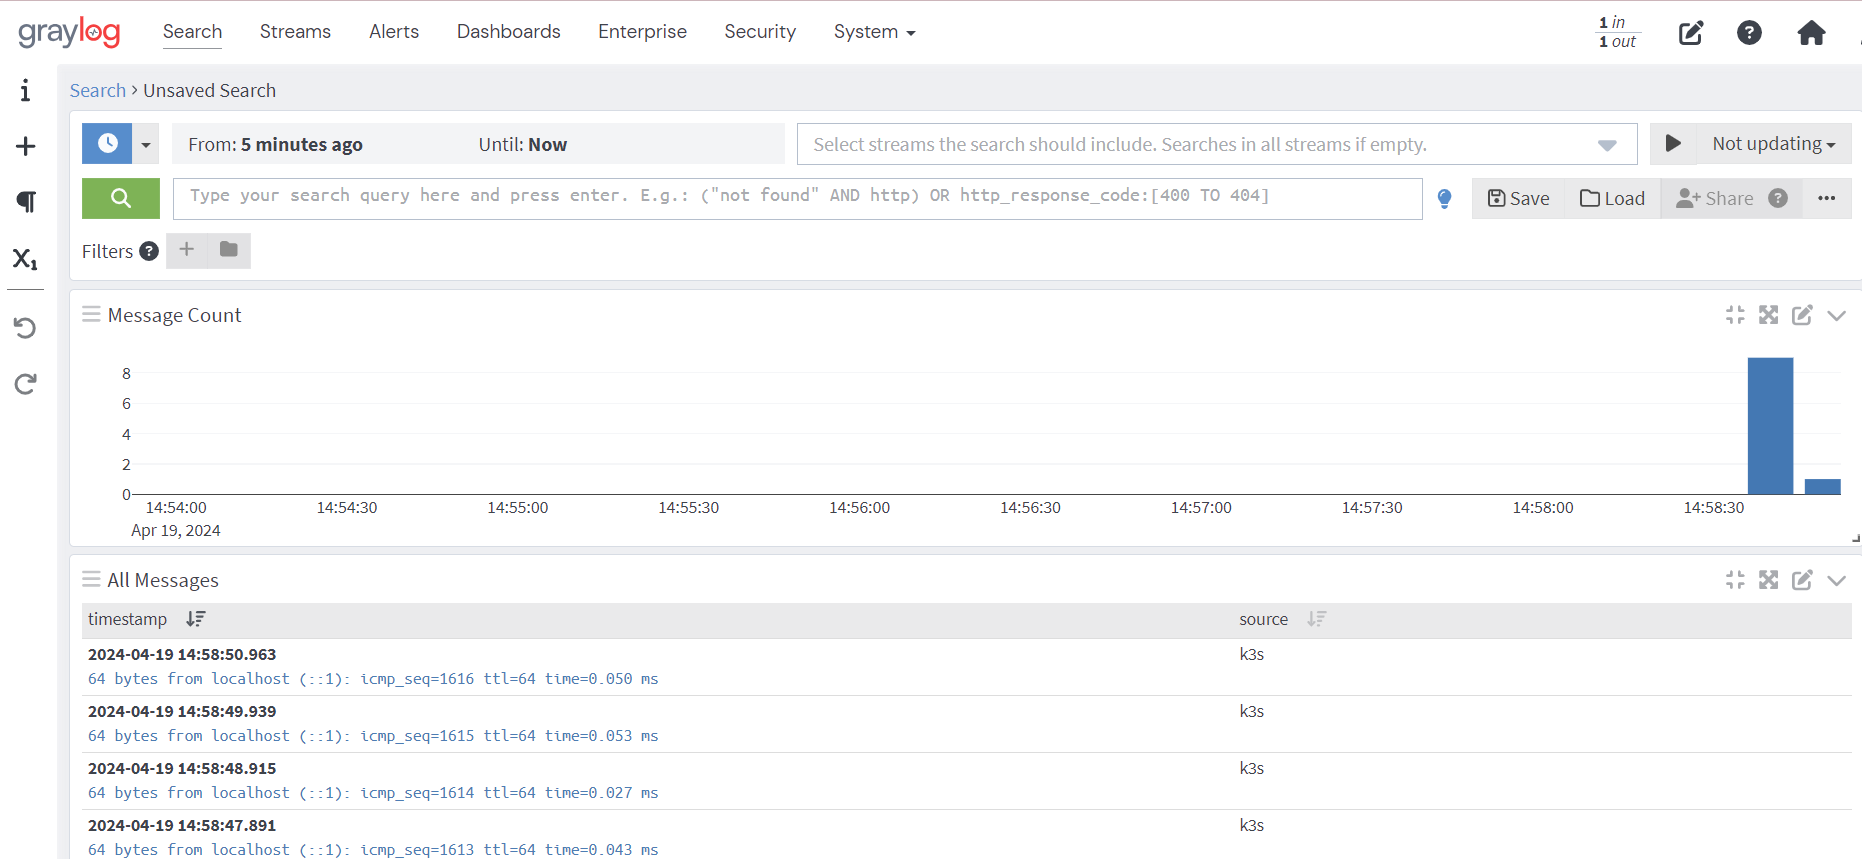
After updating the ConfigMap, let’s restart the fluent-bit using kubectl rollout command:
kubectl rollout restart ds/fluent-bit
Optional - Implementing Grok Patterns and Pipelines
For advanced log processing and filtering, consider implementing Grok patterns and pipelines within Graylog. These enable fine-grained control over log parsing and manipulation, enhancing the overall efficiency and effectiveness of log management.
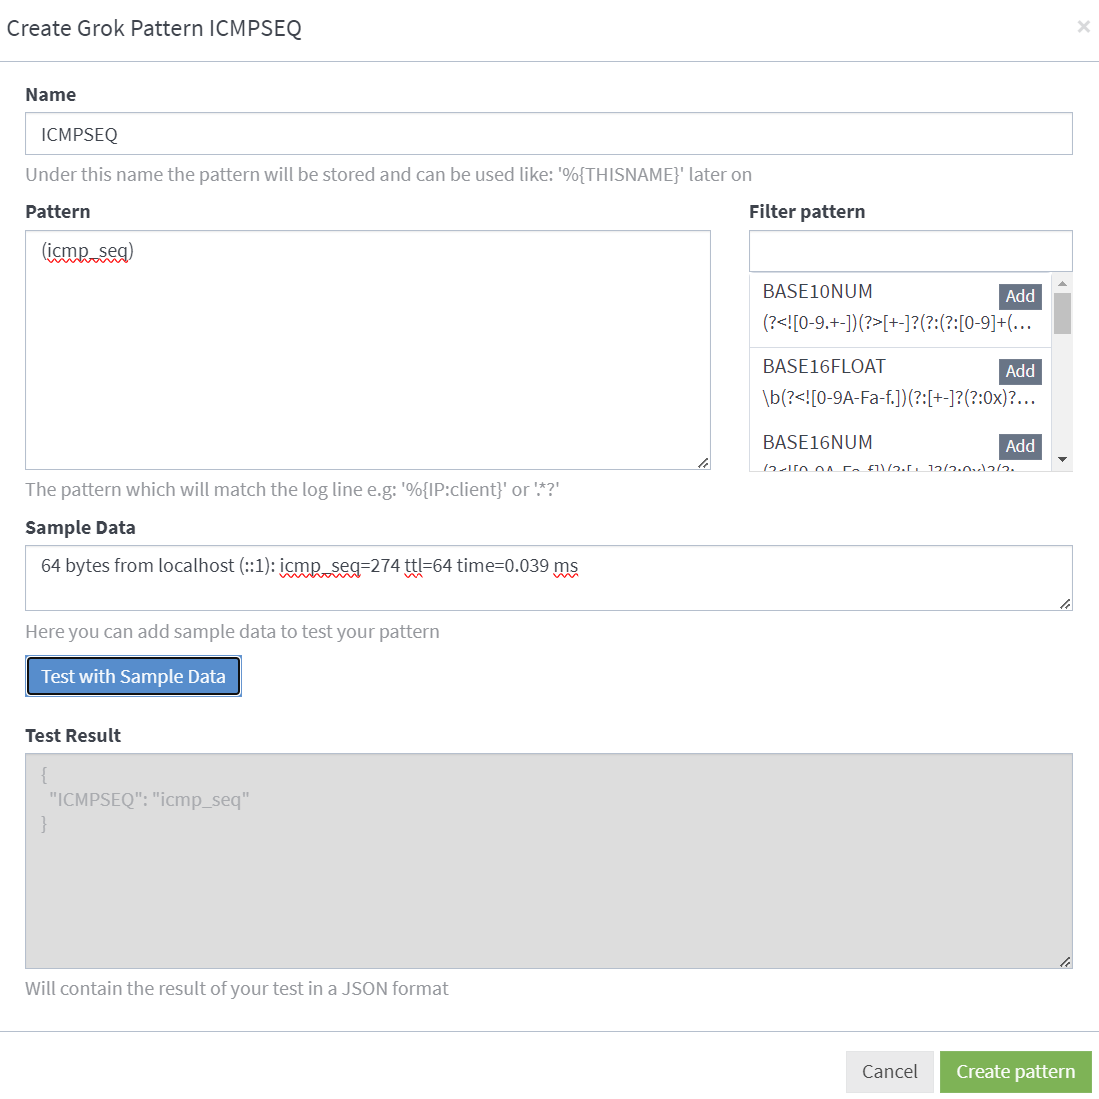
This is my GROK pattern to filter out ping command:
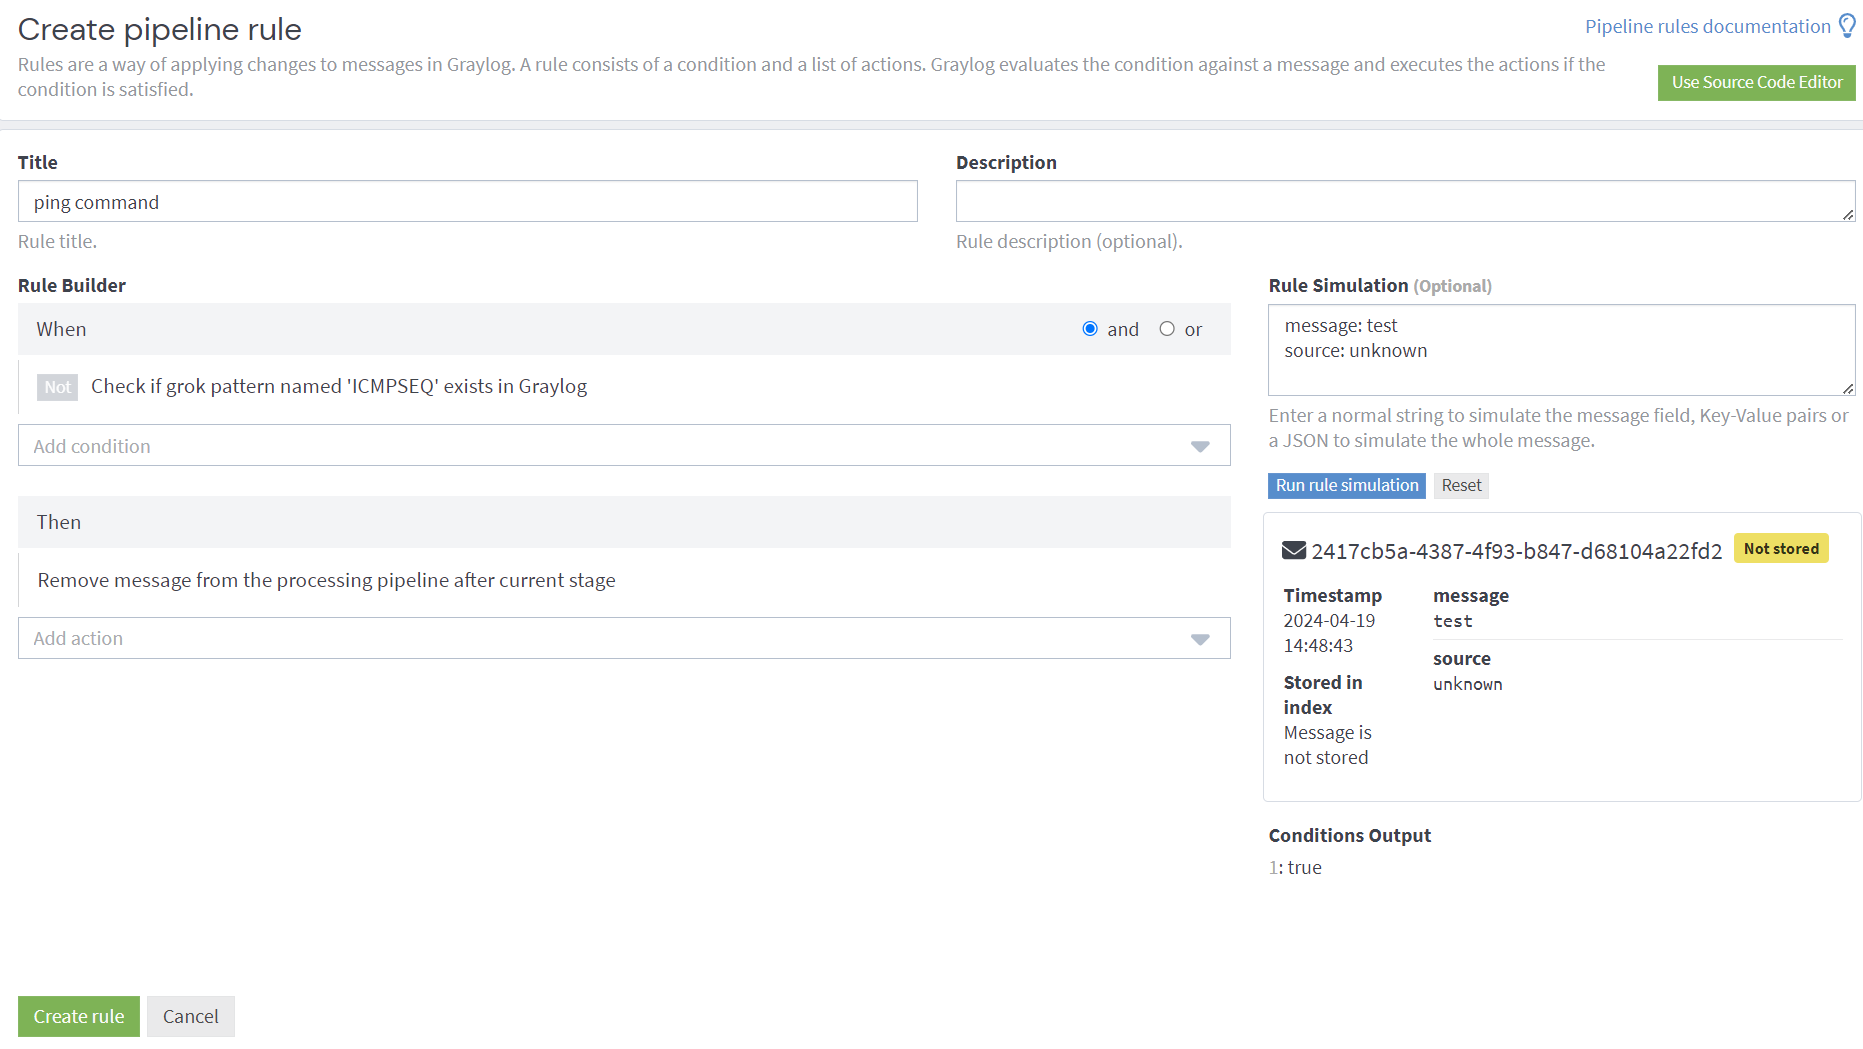
Pipelines are the central concept for typing together the processing steps applied to the incoming messages. This is my ping command rule:
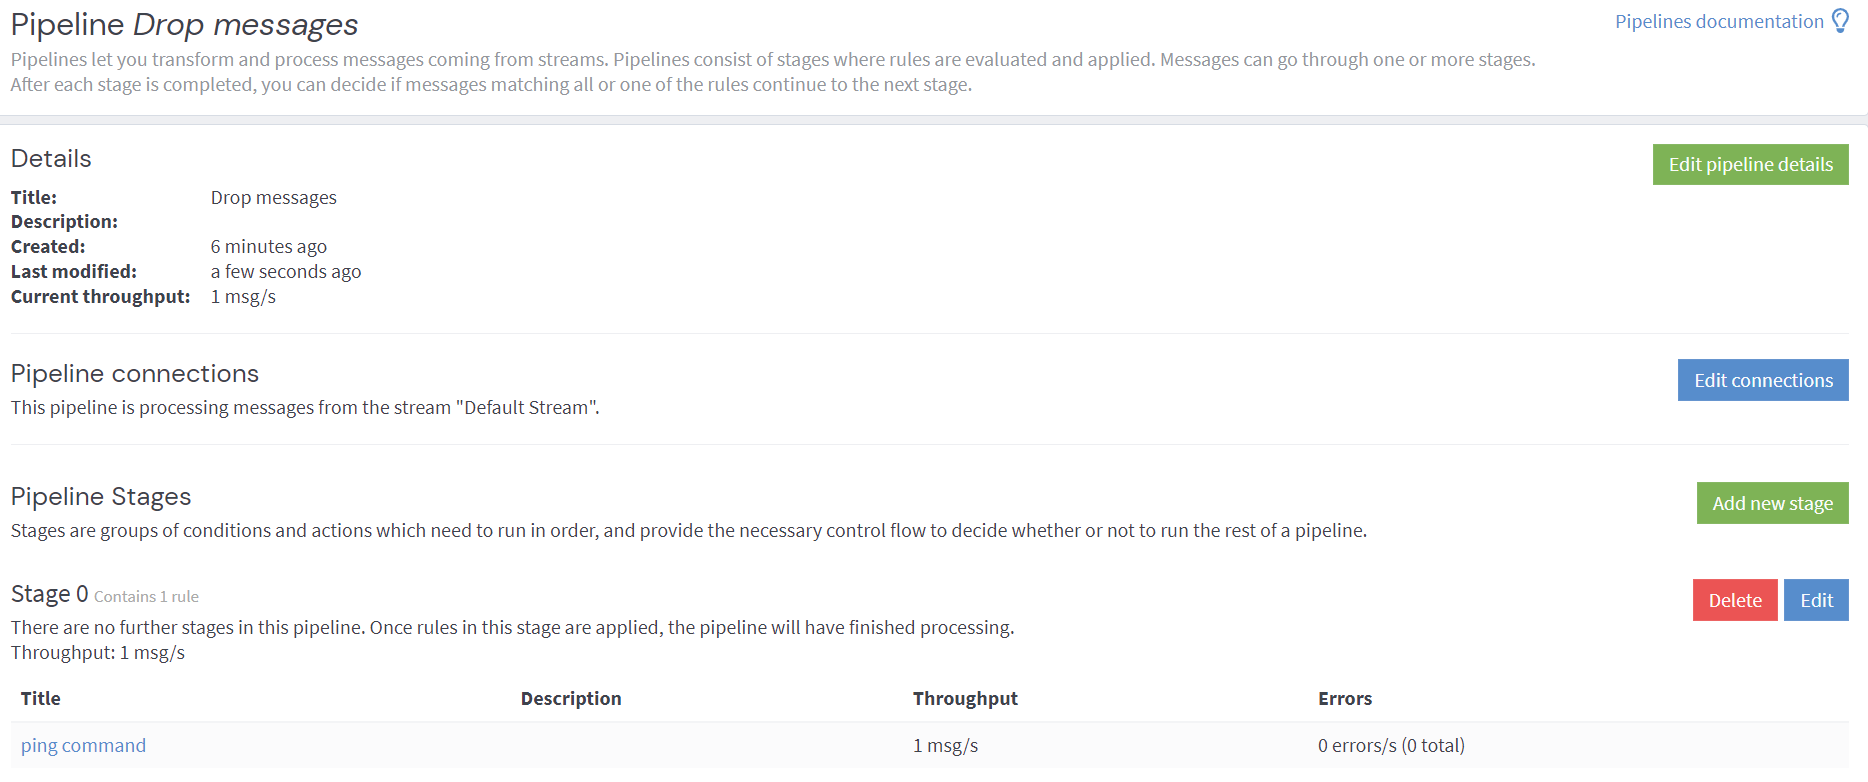
Adds the rule to the pipeline, so as to filter out any ping commands from the source logs.
Troubleshooting and Network Analysis
In case of any issues or network-related concerns, leverage troubleshooting tools like netshoot and tcpdump to diagnose and resolve issues promptly. These tools facilitate comprehensive network analysis, ensuring seamless operation of the log management infrastructure.
spec:
  ...
  template:
    ...
    spec:
      containers:
      - name: netshoot
        image: nicolaka/netshoot
        command: ["/bin/bash"]
        args: ["-c", "while true; do ping localhost; sleep 60;done"]
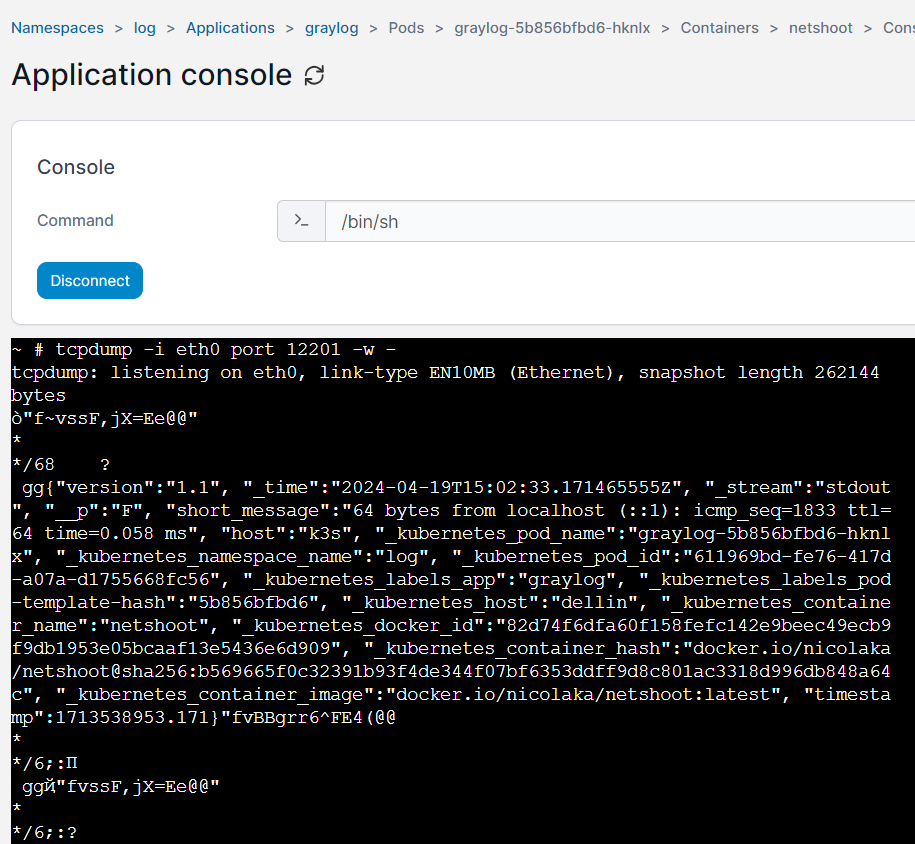
You may enter the console from portainer and issue the command to check for incoming messages:
tcpdump -i eth0 port 12201 -w -
With these configurations and best practices in place, your HomeLab environment is equipped with a robust and scalable log management solution, empowering you to effectively monitor and analyze system logs with Graylog.